All Charts blocks
Every Charts block side by side, with a picture and description of each. Open one for its preview, props and install.
39 blocks, A to Z.
Balance Backdrop Line
area-chart-03
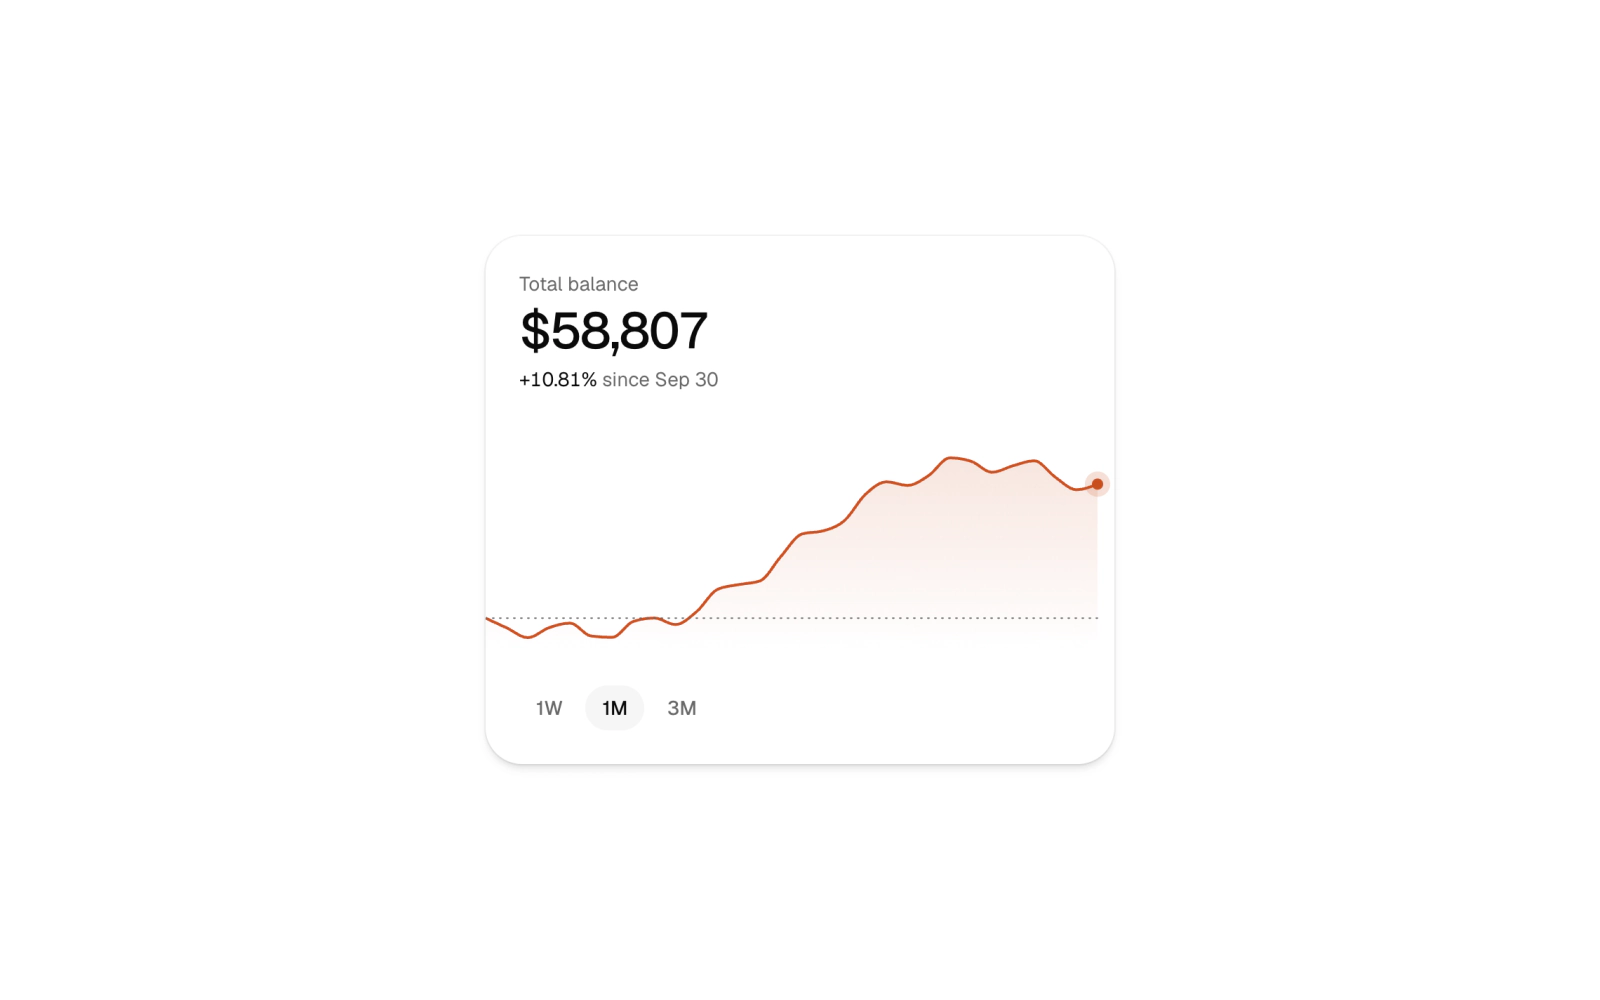
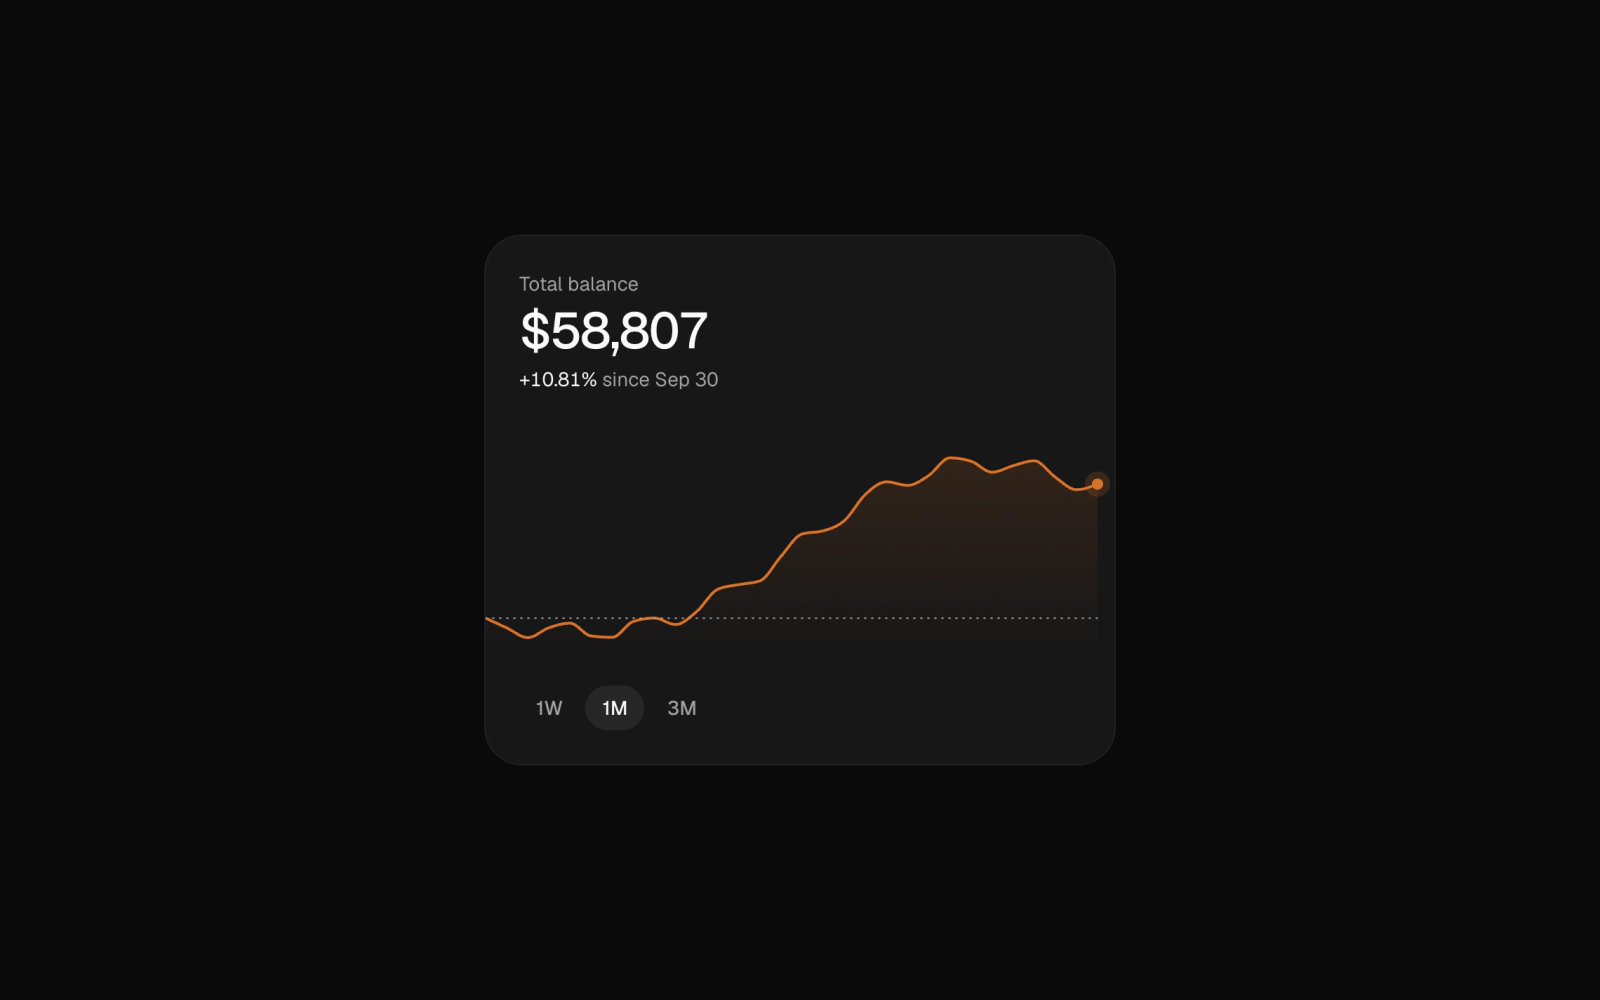
Balance card where the number leads and an edge-to-edge area line sits behind it: no grid or axes, a dotted line at the period opening, a halo on the last point and 1W, 1M and 3M range buttons.
Budget Allocation Ring
radial-chart-05
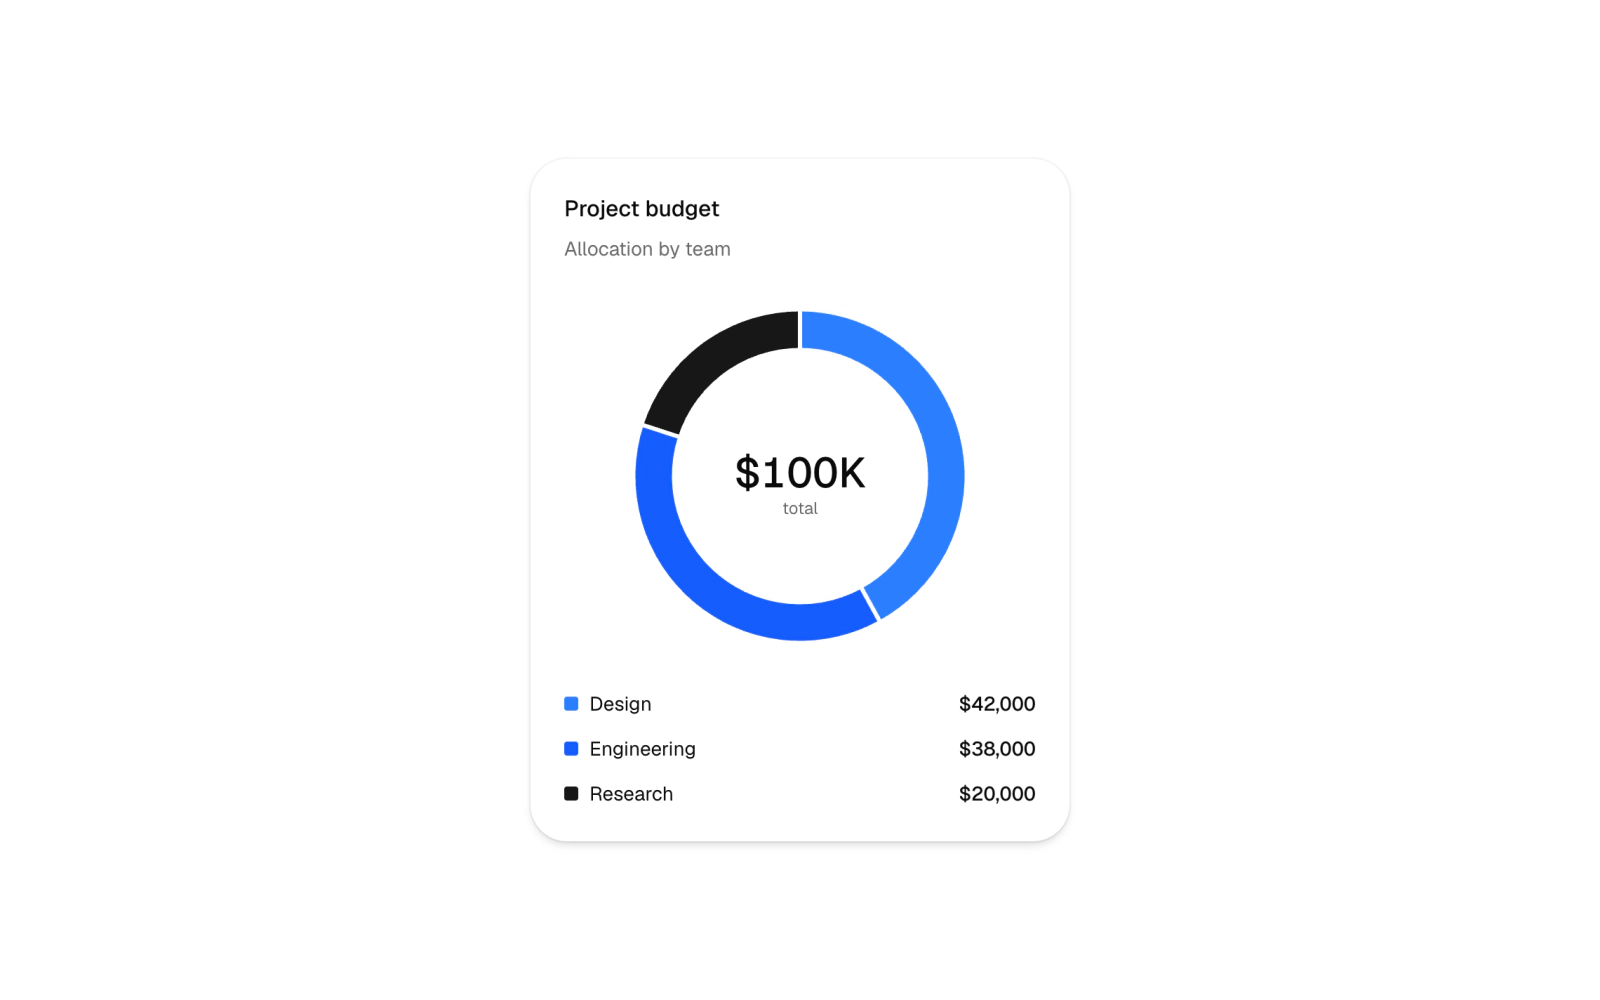
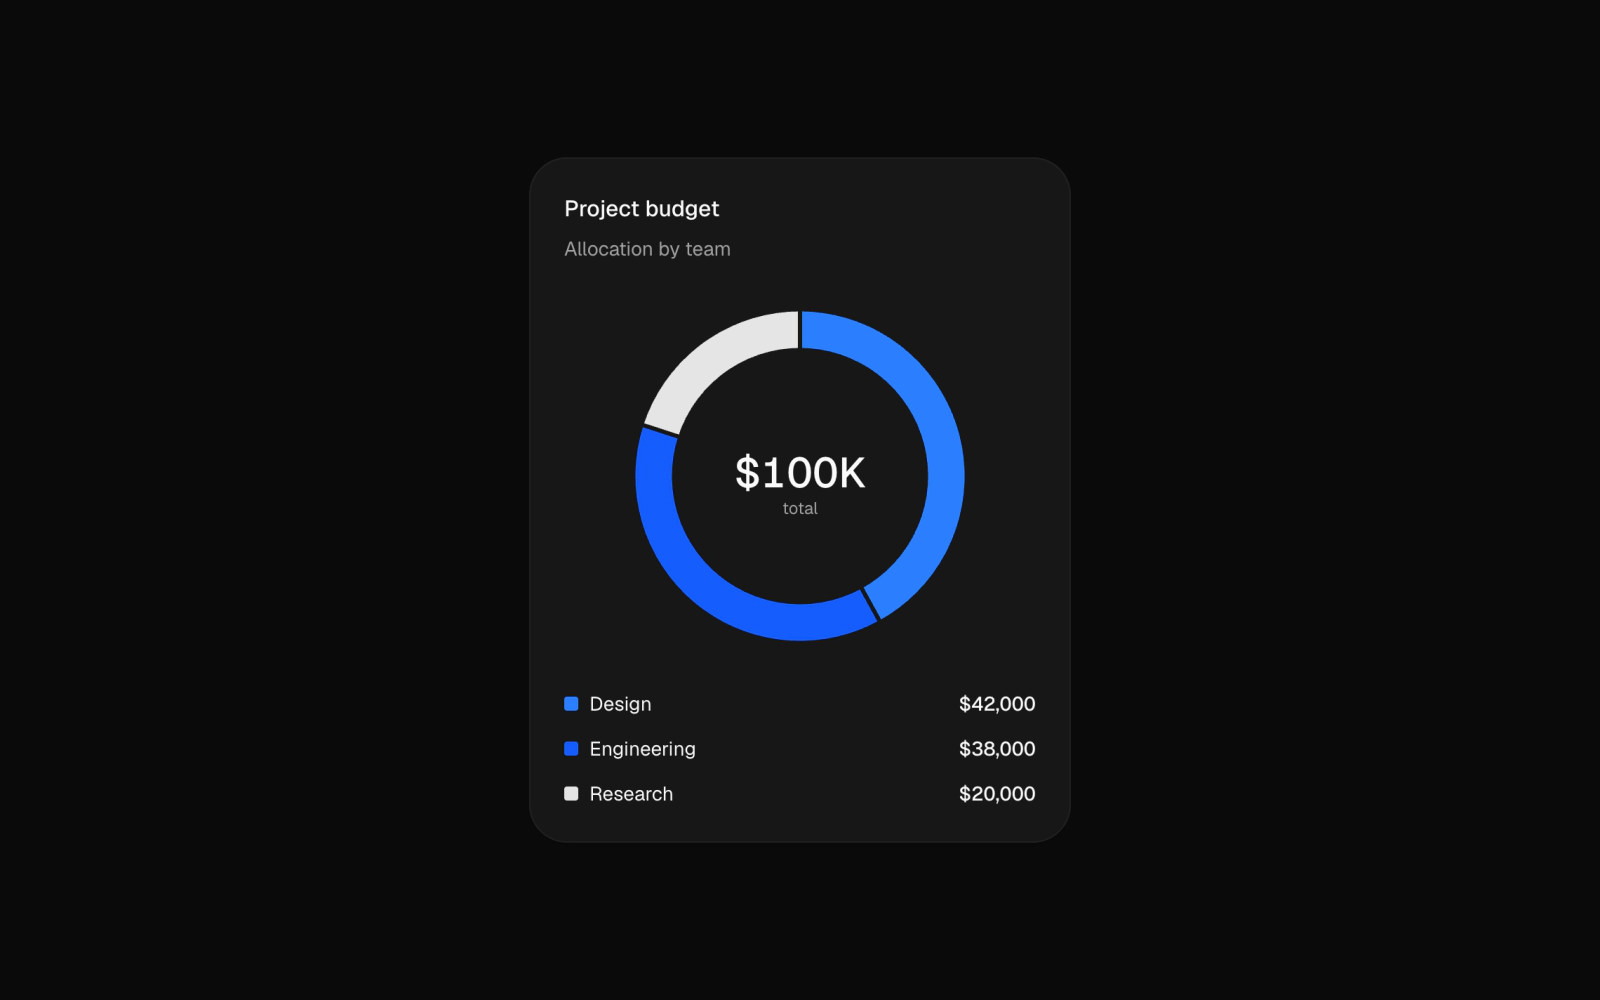
Segmented radial chart for budget allocation: a full ring split into three stacked segments, with the total at its center and a text breakdown below.
Daily Target Rings
radial-chart-03
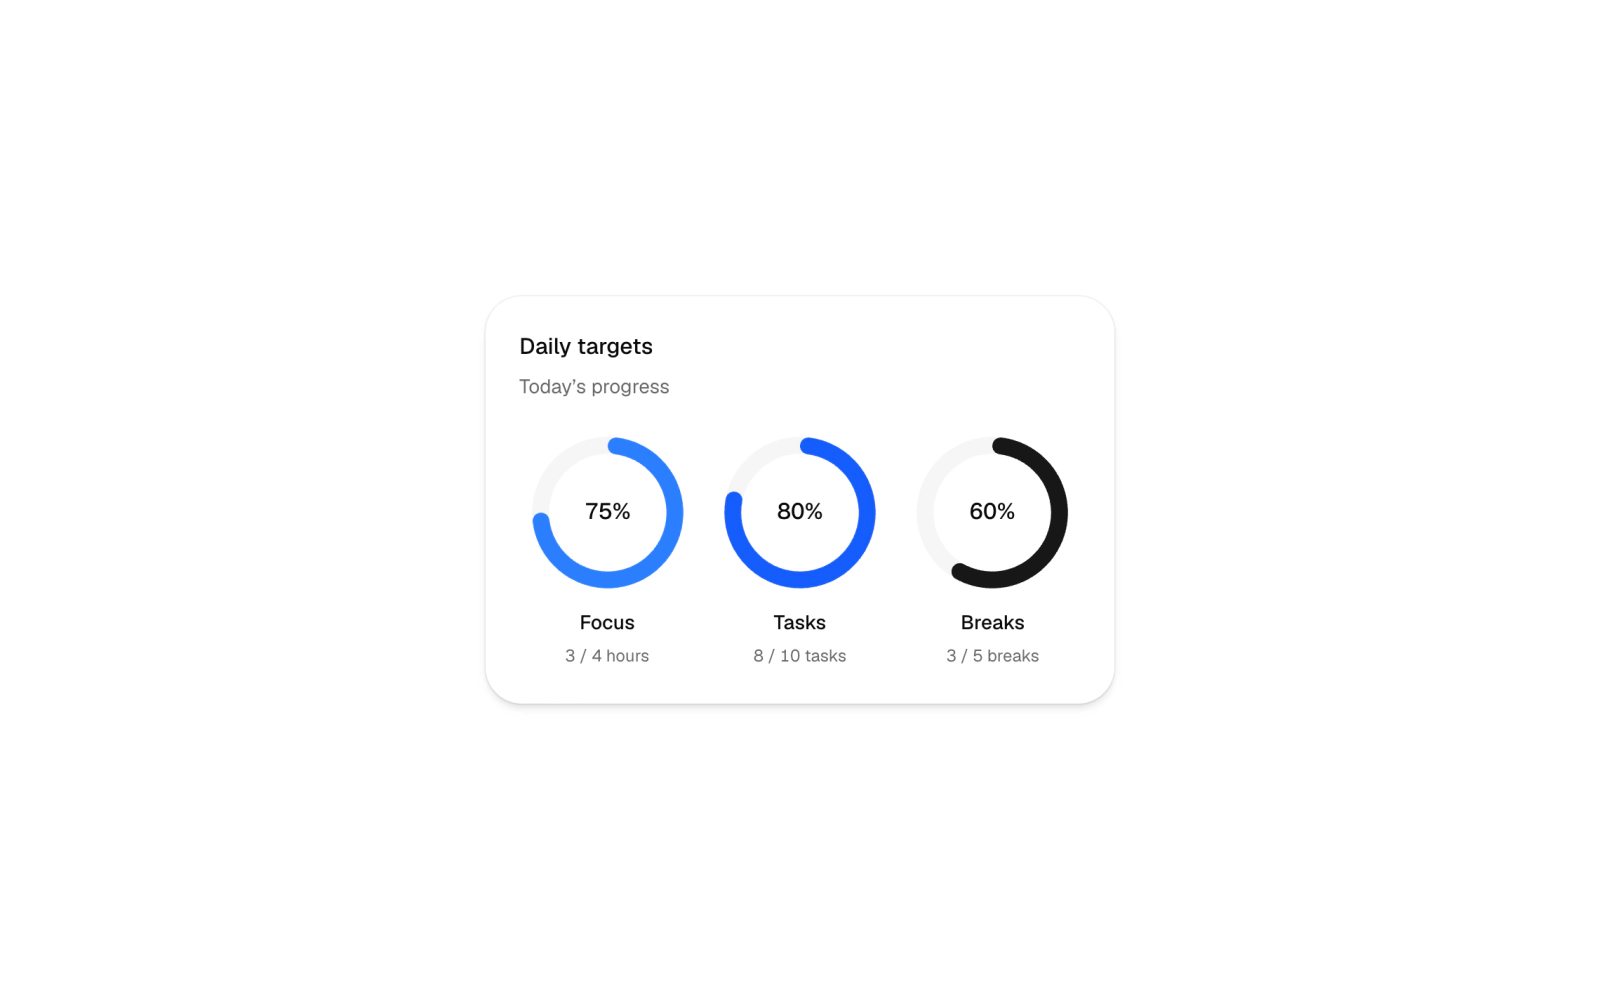
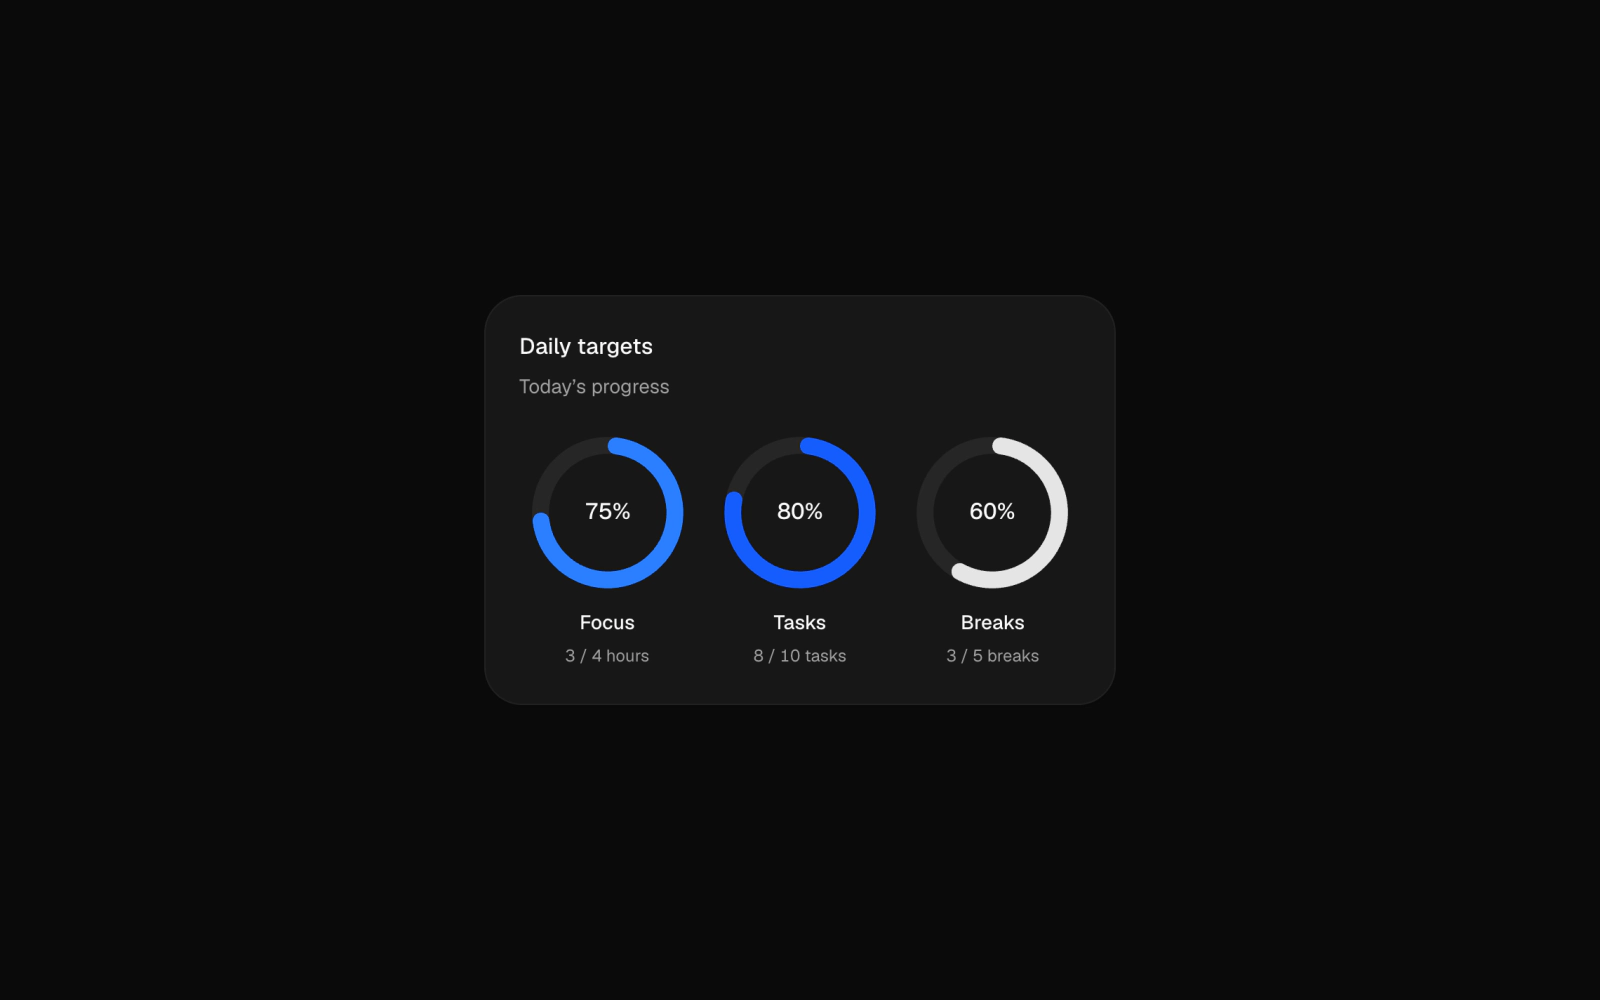
Three small radial progress rings for daily goals: focus hours, tasks and breaks. Each ring has a percentage, label and exact target, so progress reads without relying on color. Built on shadcn Card and Chart with recharts 3.8.
Device Split
device-split-01
Donut chart of sessions by desktop, mobile and tablet with a selectable legend.
Diverging Bar Chart
bar-chart-03
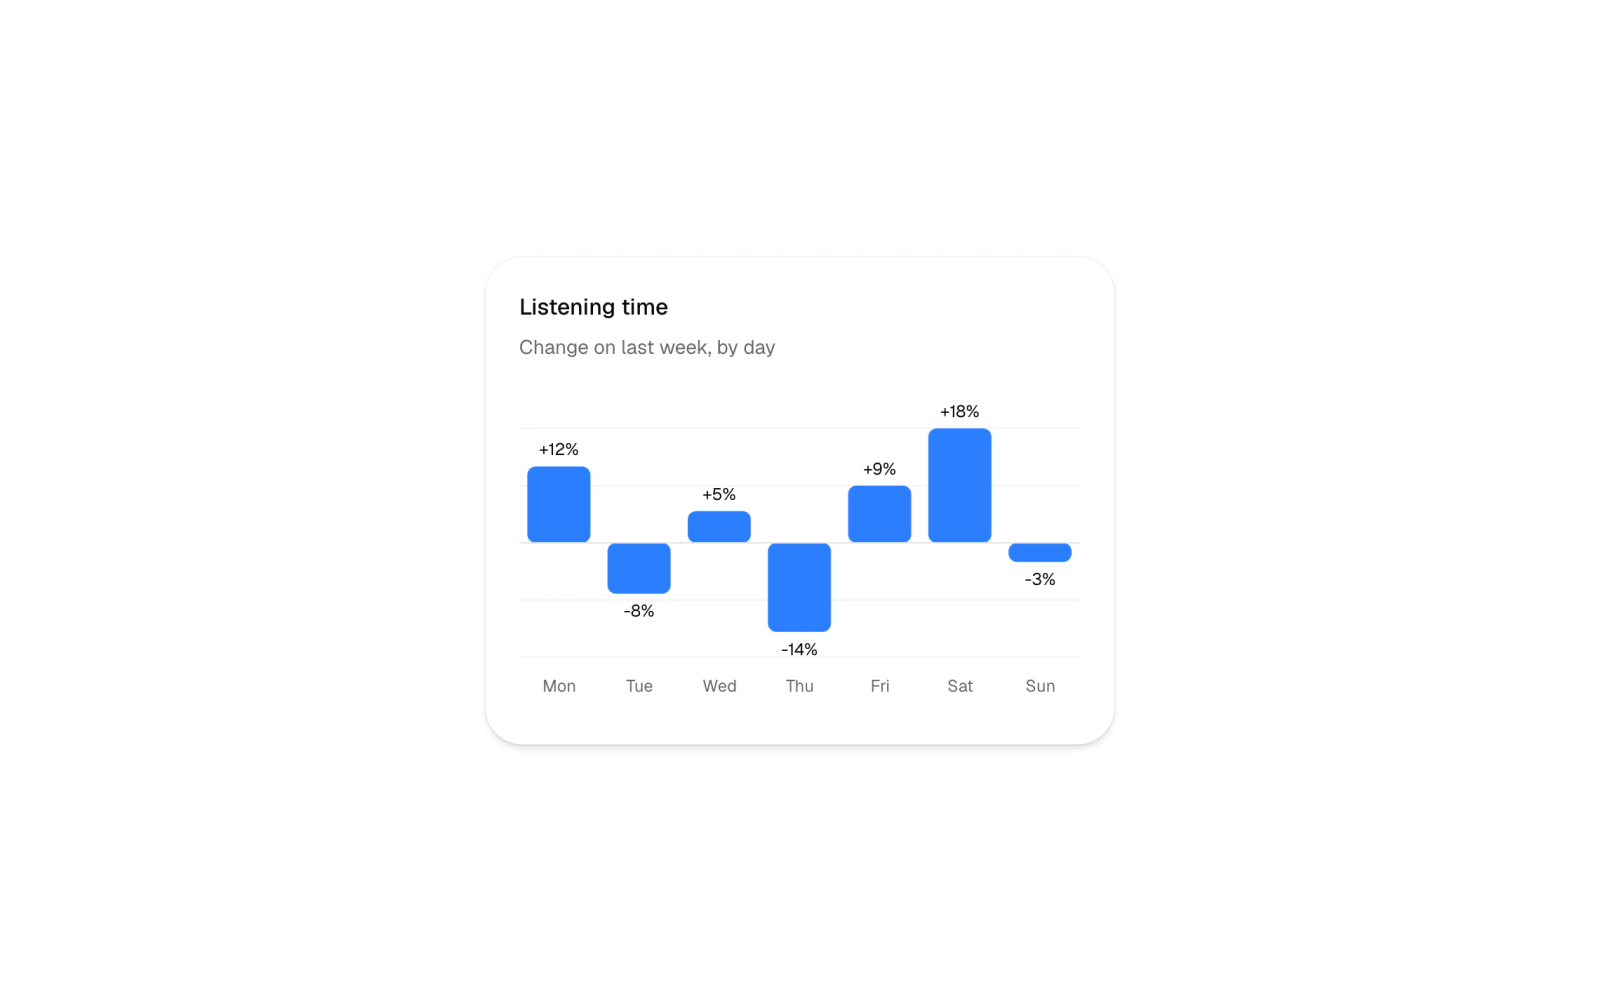
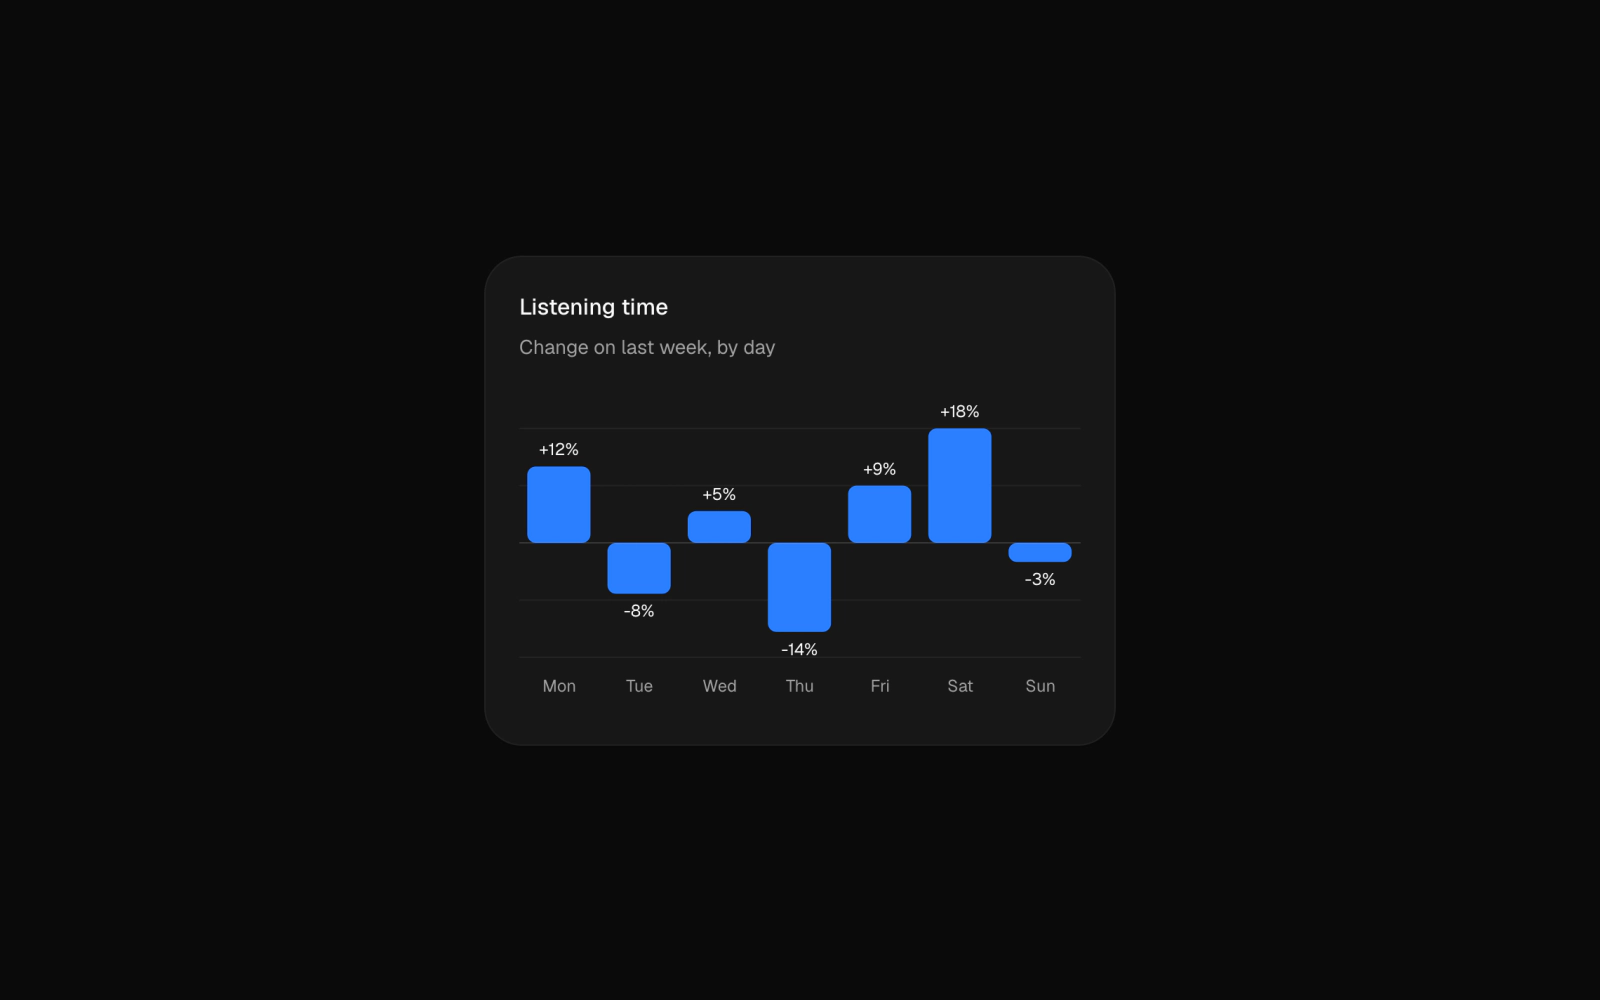
Positive and negative bar chart card for weekly change: a diverging column chart of week-on-week variance by day, bars rising and falling from a zero line with signed percentage labels.
Donut Chart with Center Total
pie-chart-01
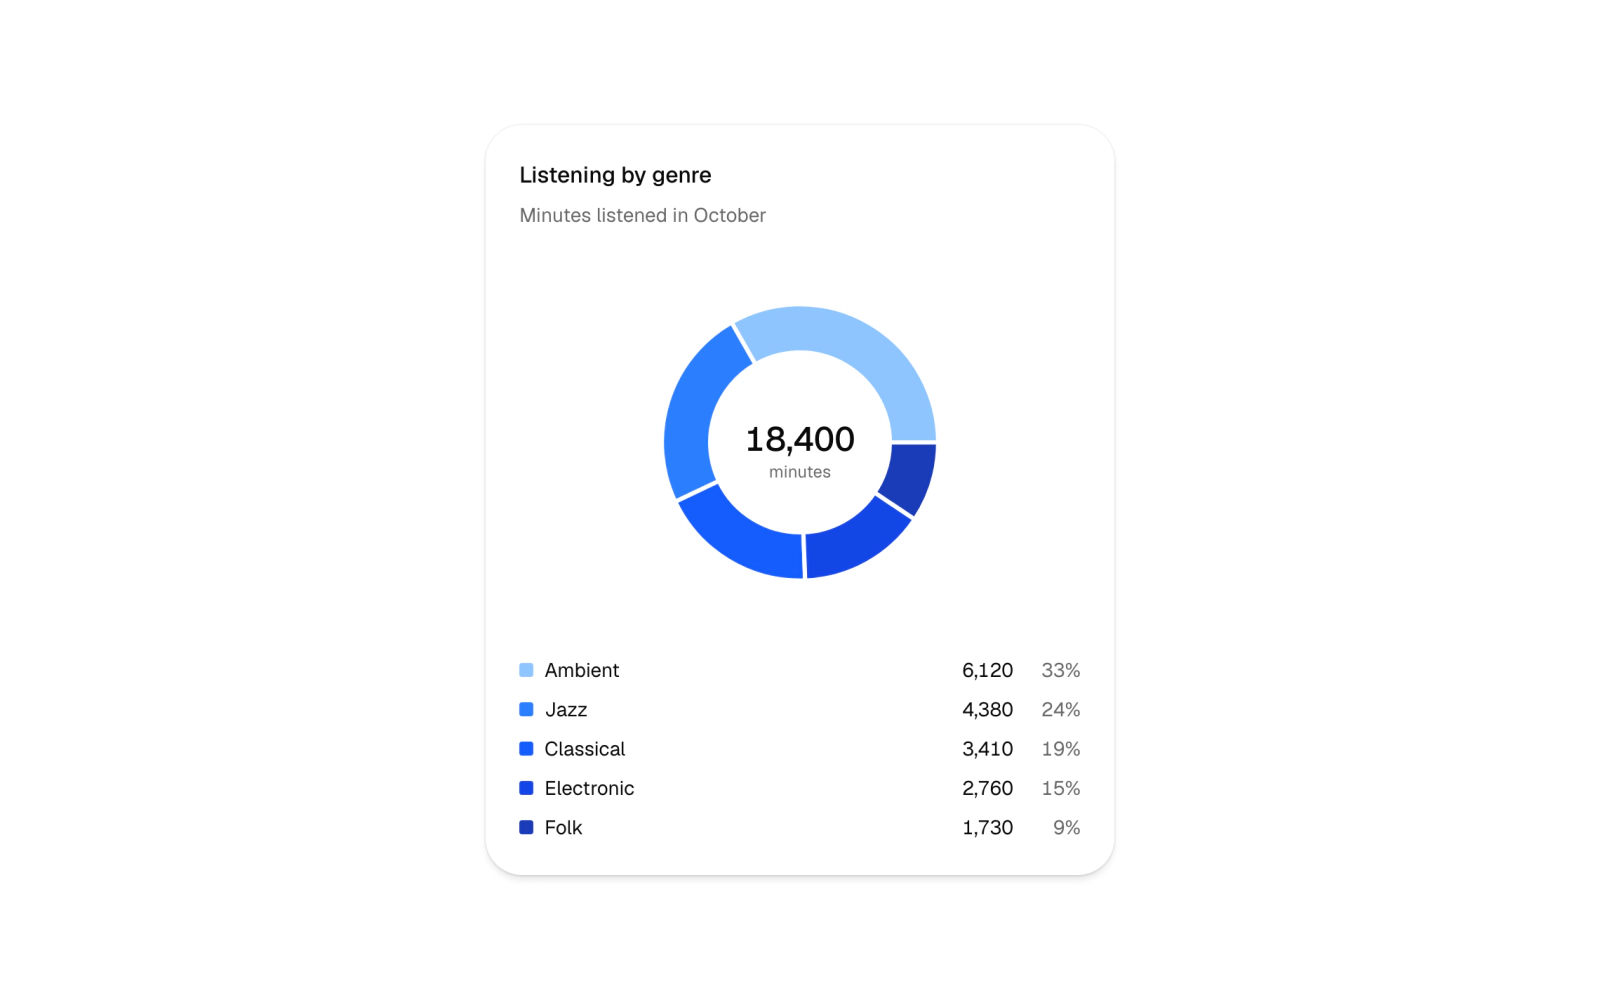
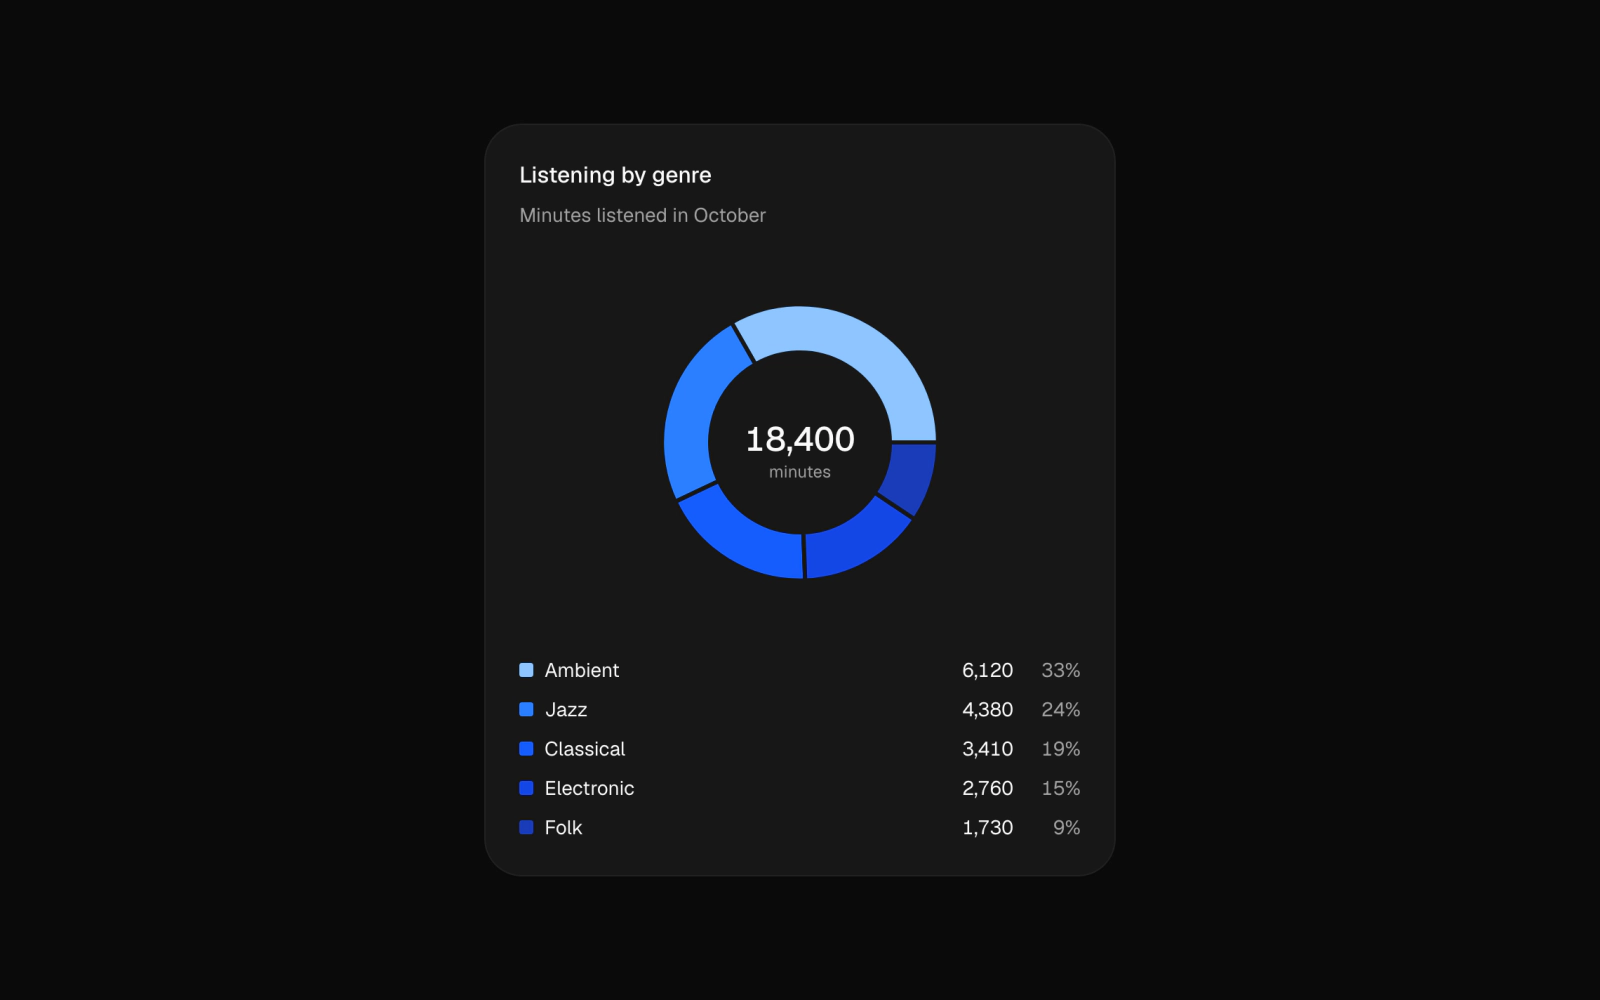
Donut chart card for a breakdown and distribution: minutes by genre with the total printed in the center, and a footer list giving each genre's swatch, minutes and share.
Exercise Minutes
exercise-minutes
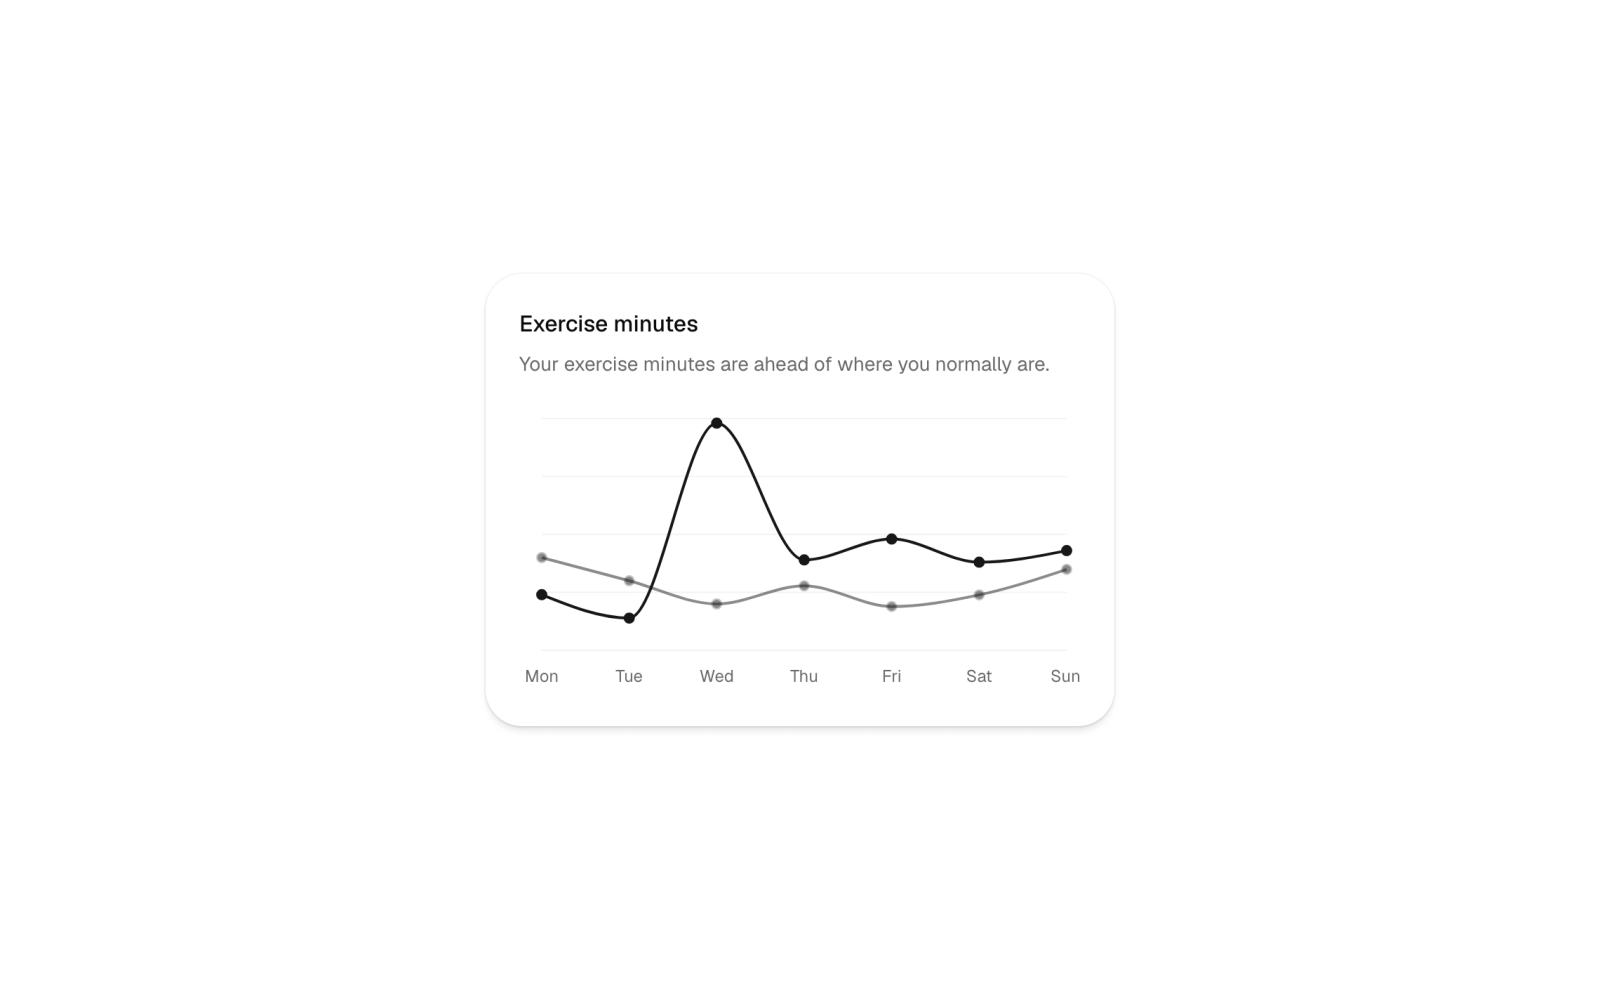
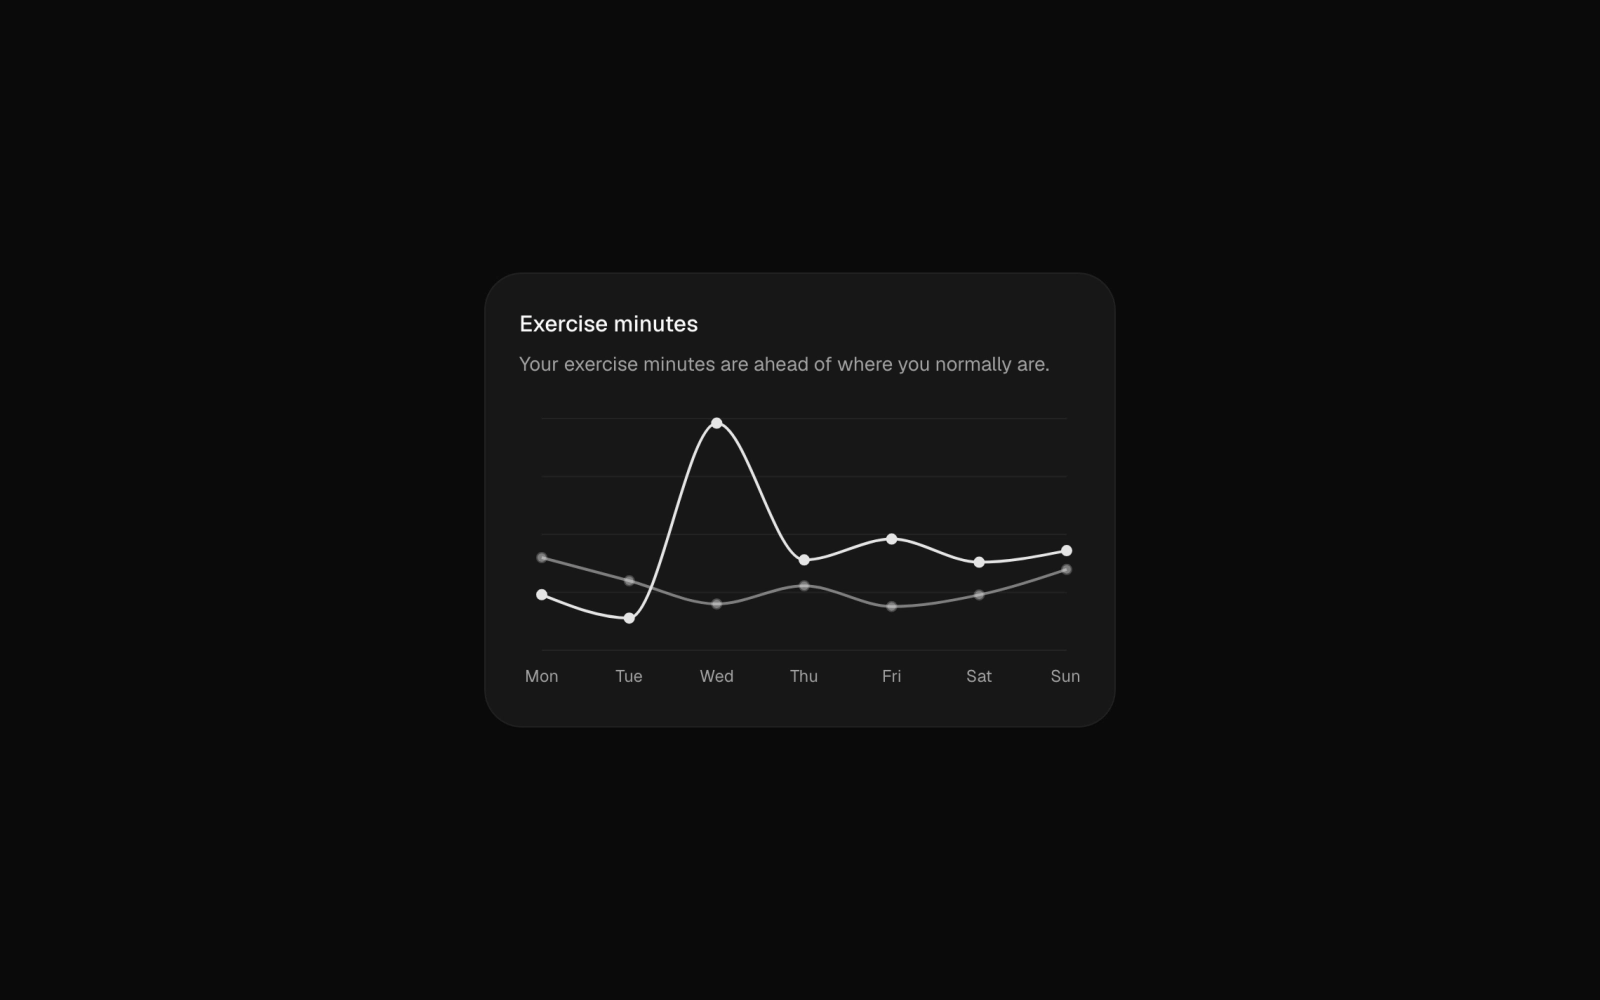
Line chart card for fitness and workout tracking: this week's exercise minutes compared with the average by day, both in primary ink with the average at half strength.
Fine Country Bars
bar-chart-05
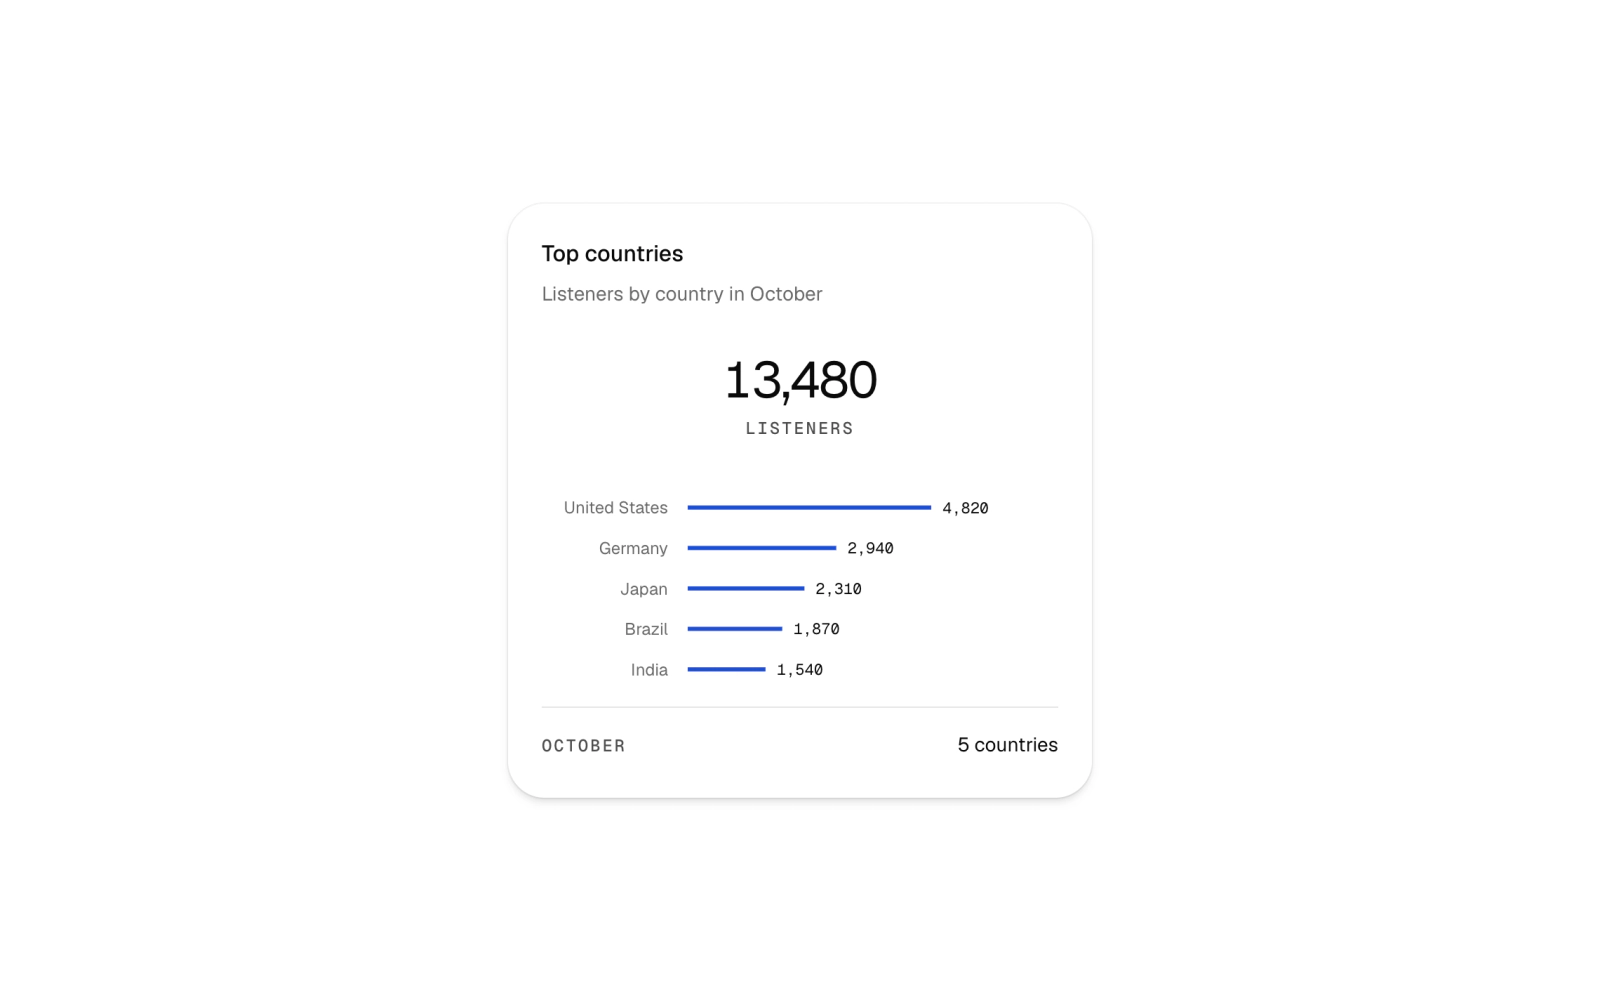
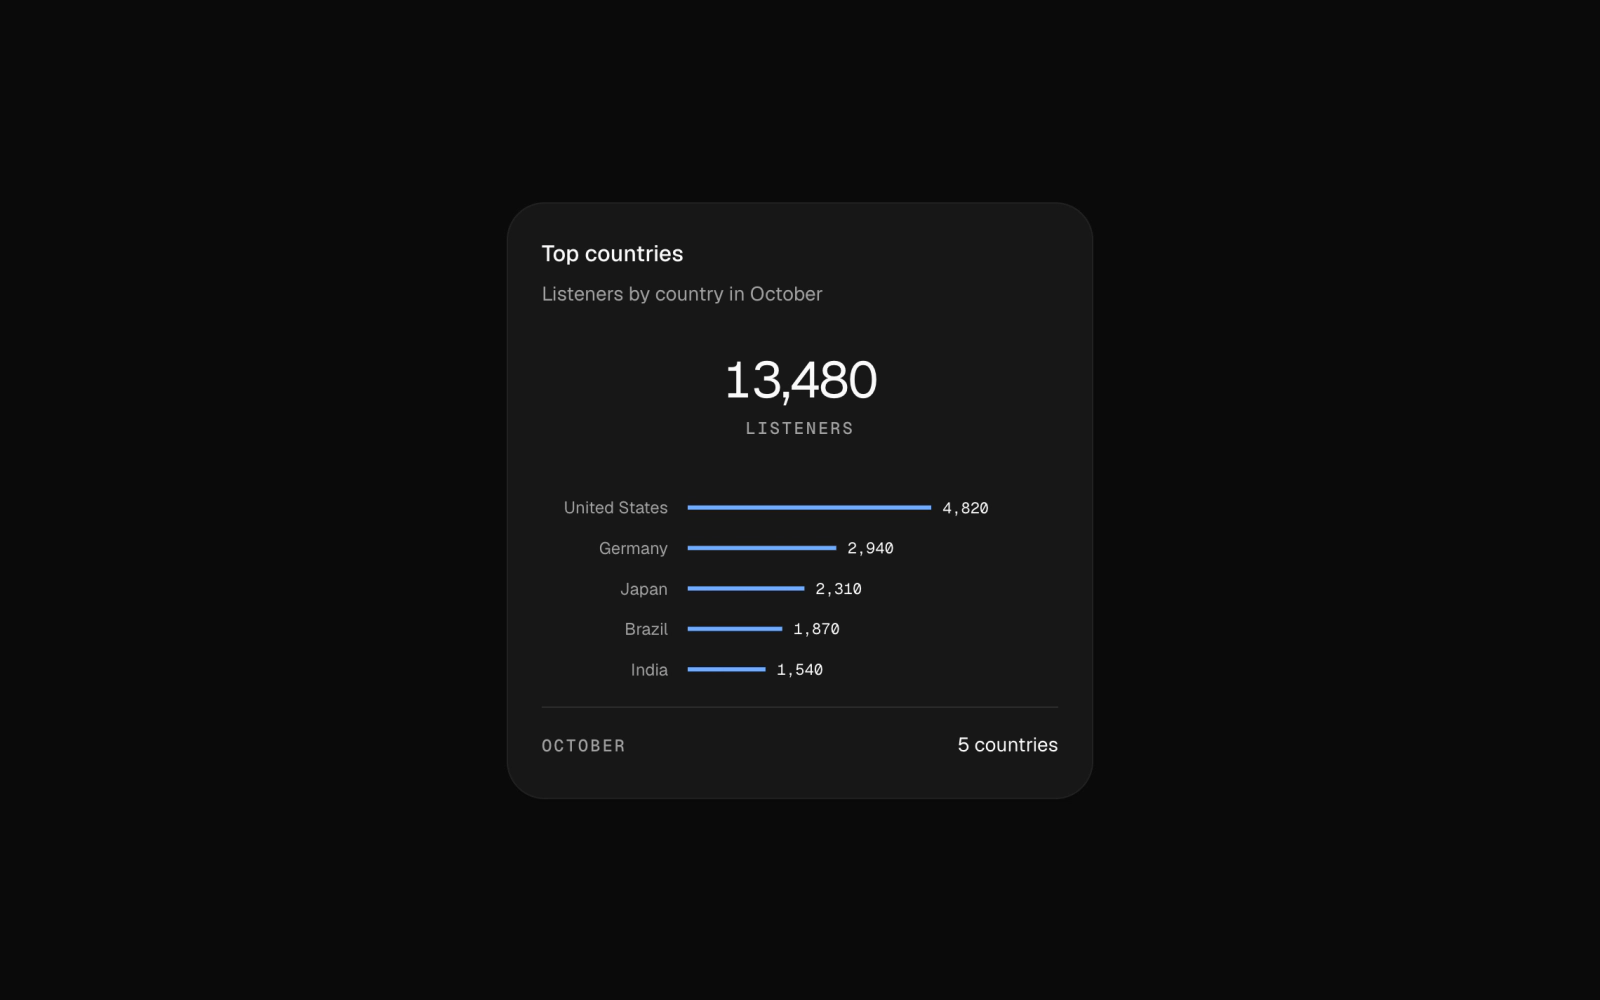
Fine horizontal bar chart for dashboards: listener bars with country labels, exact values and a ruled October caption.
Fine Exercise Lines
exercise-minutes-02
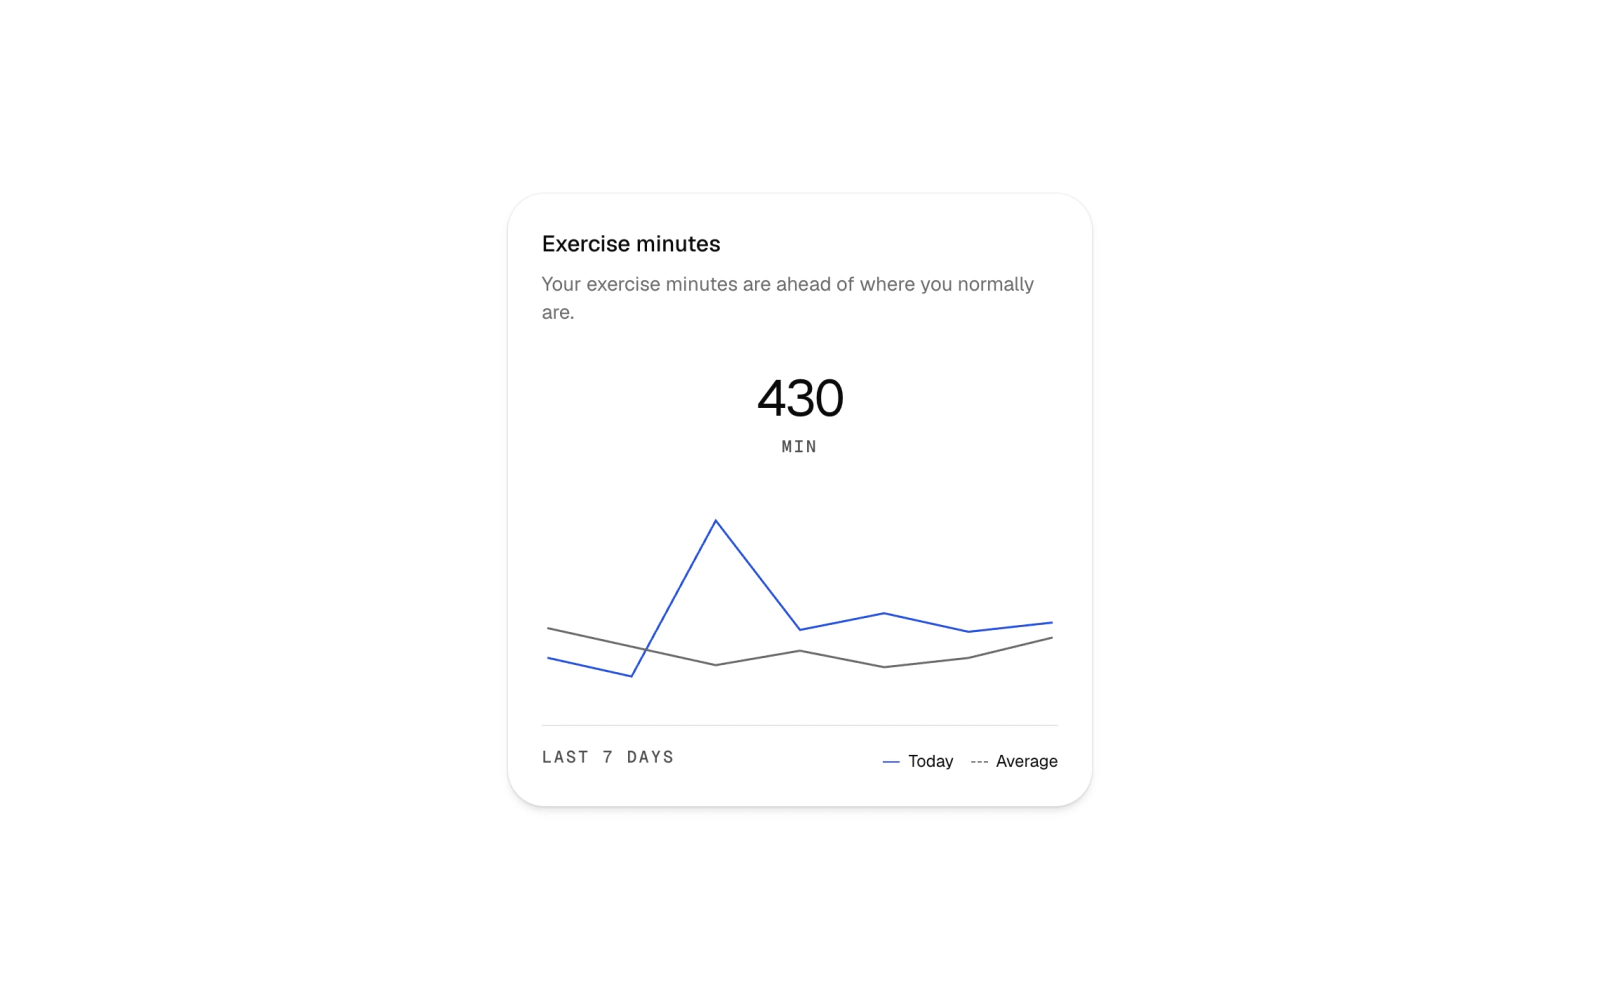
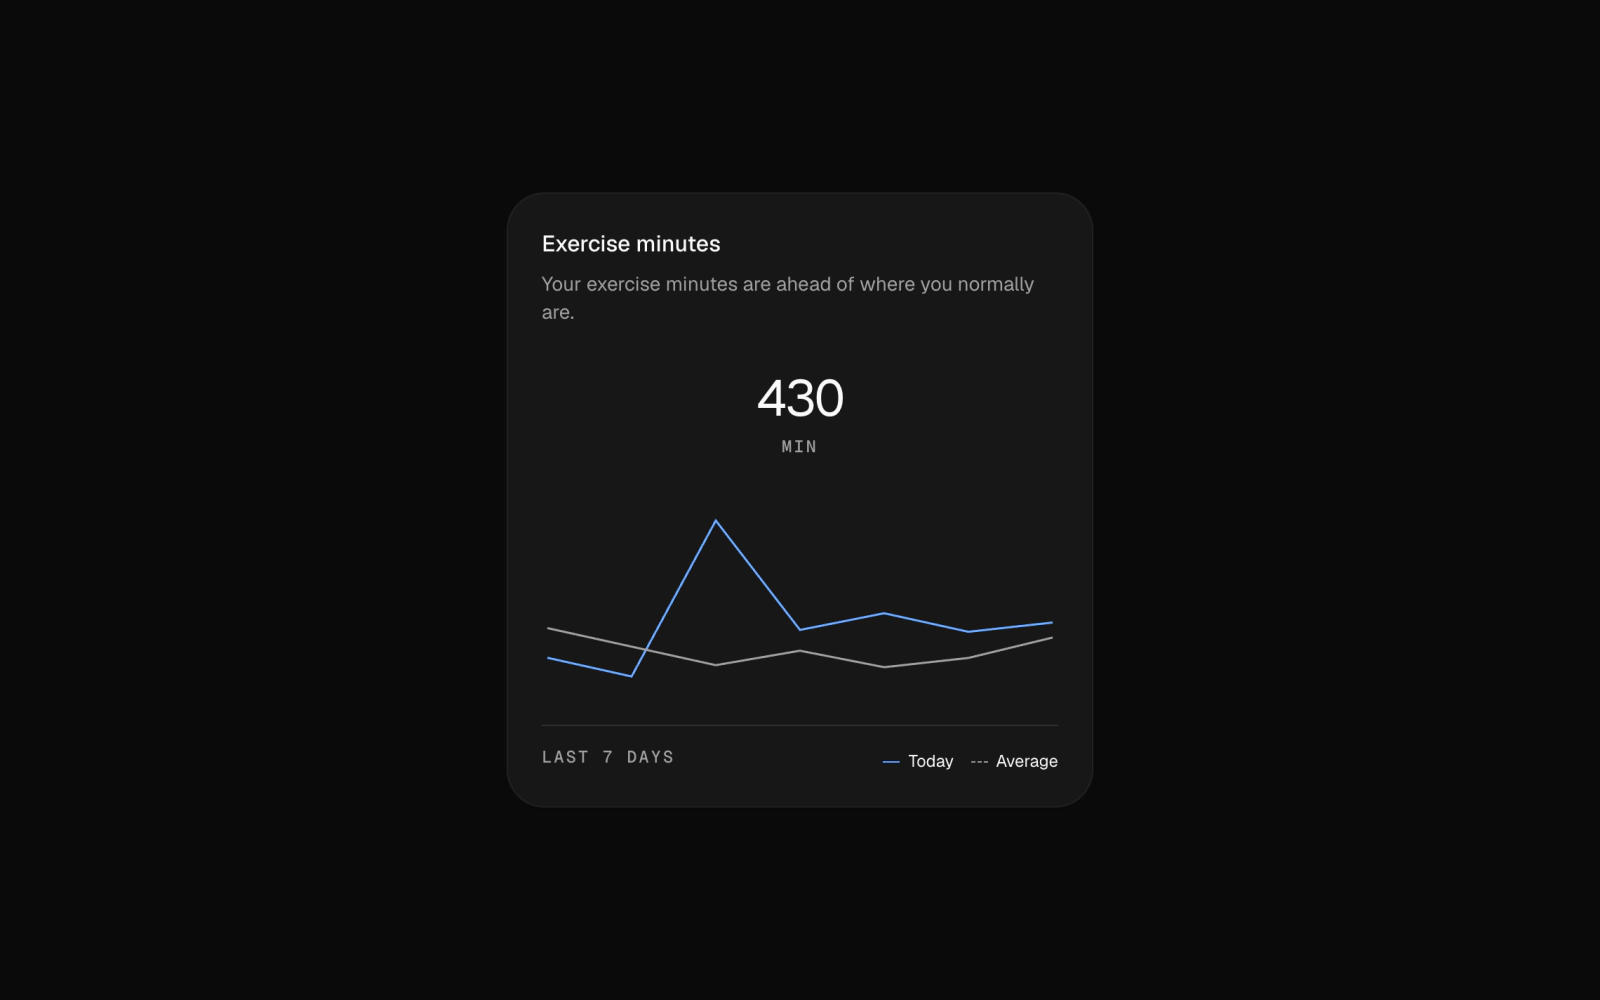
Fine line chart for fitness dashboards: orange exercise minutes against a dashed gray average, with a current value and labeled line keys.
Fine Genre Ring
pie-chart-02
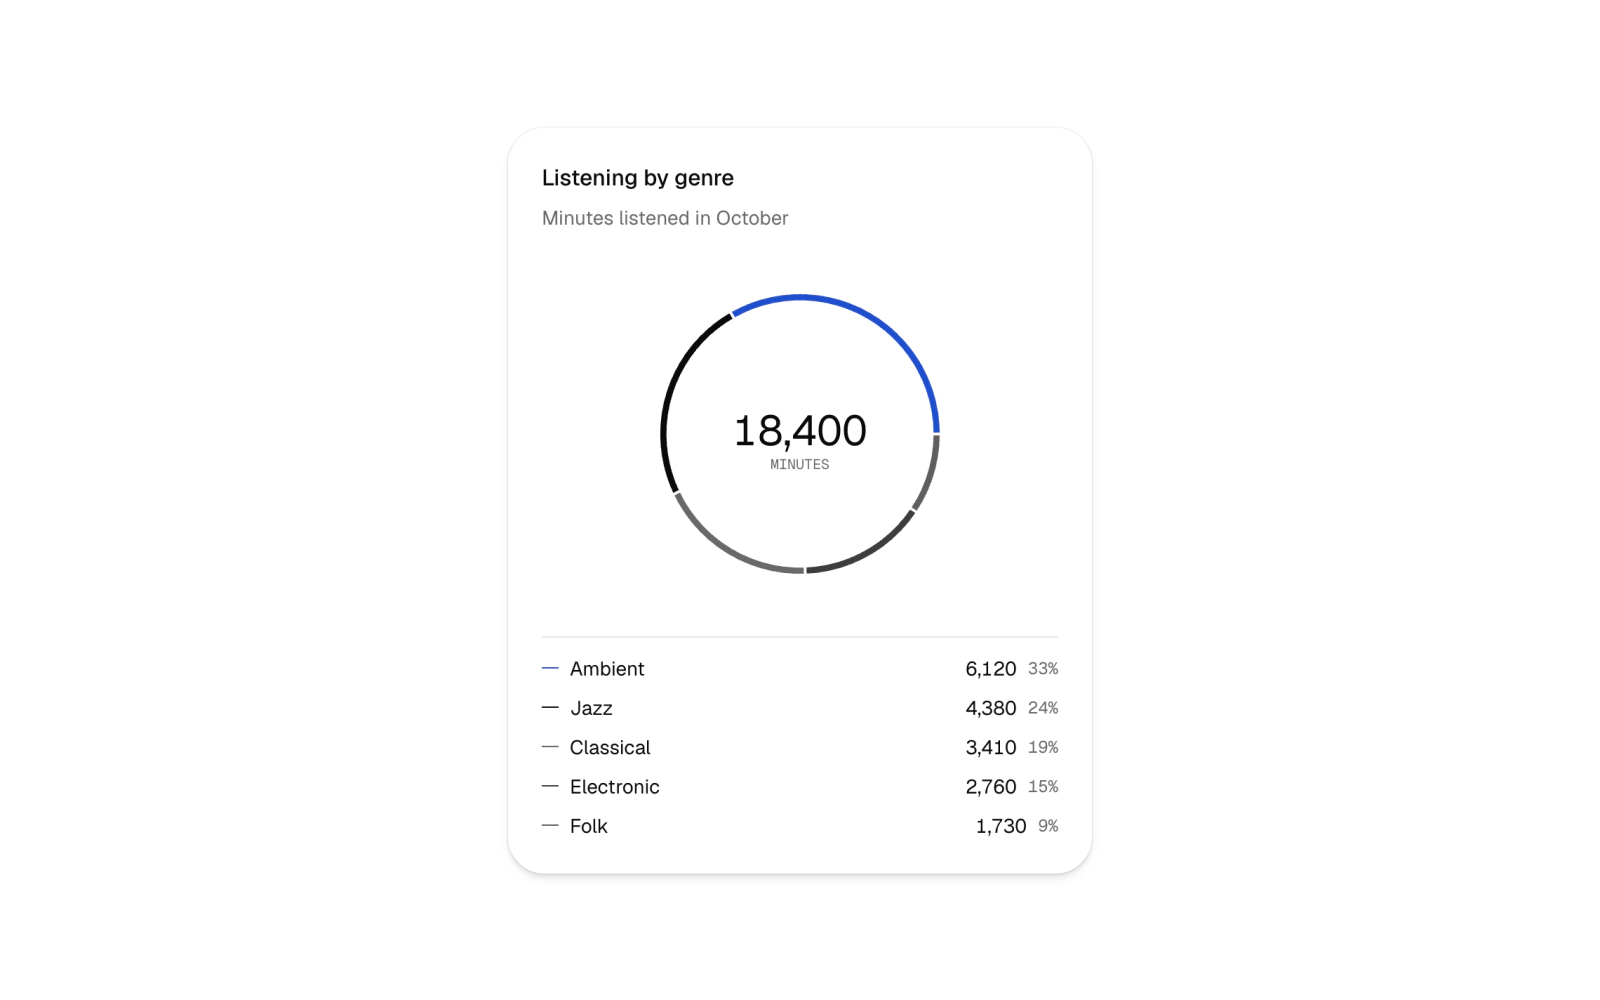
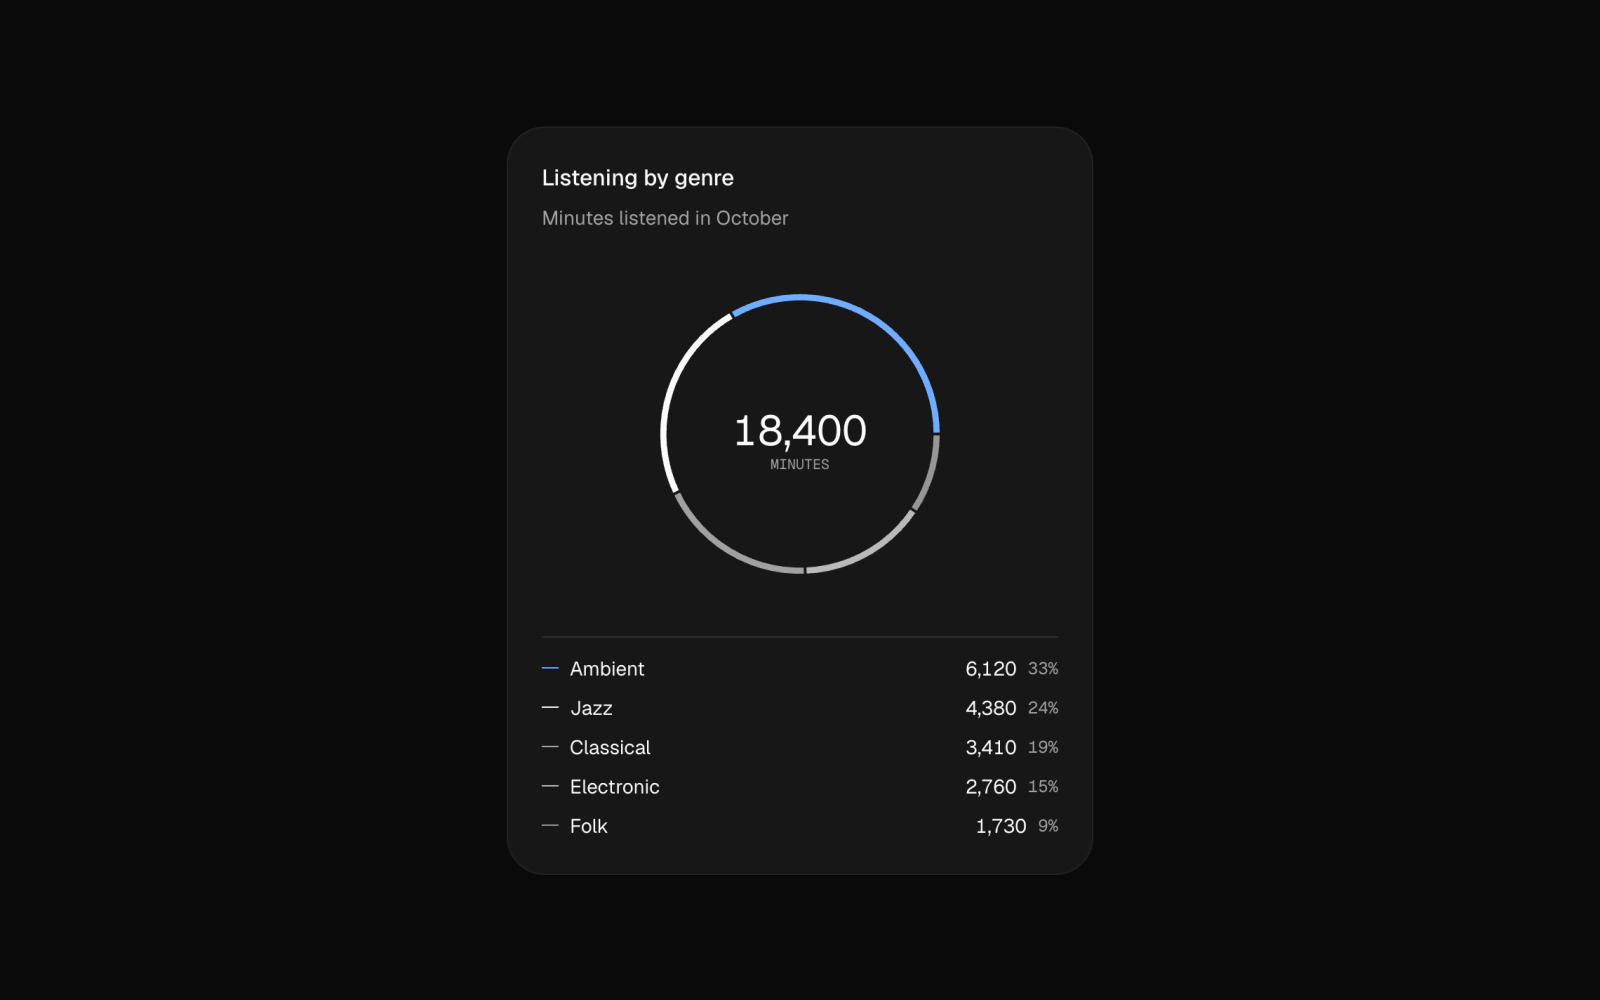
Fine donut chart for dashboards: a thin genre ring with orange and neutral segments, a center total and a complete text breakdown.
Fine Listener Areas
area-chart-02
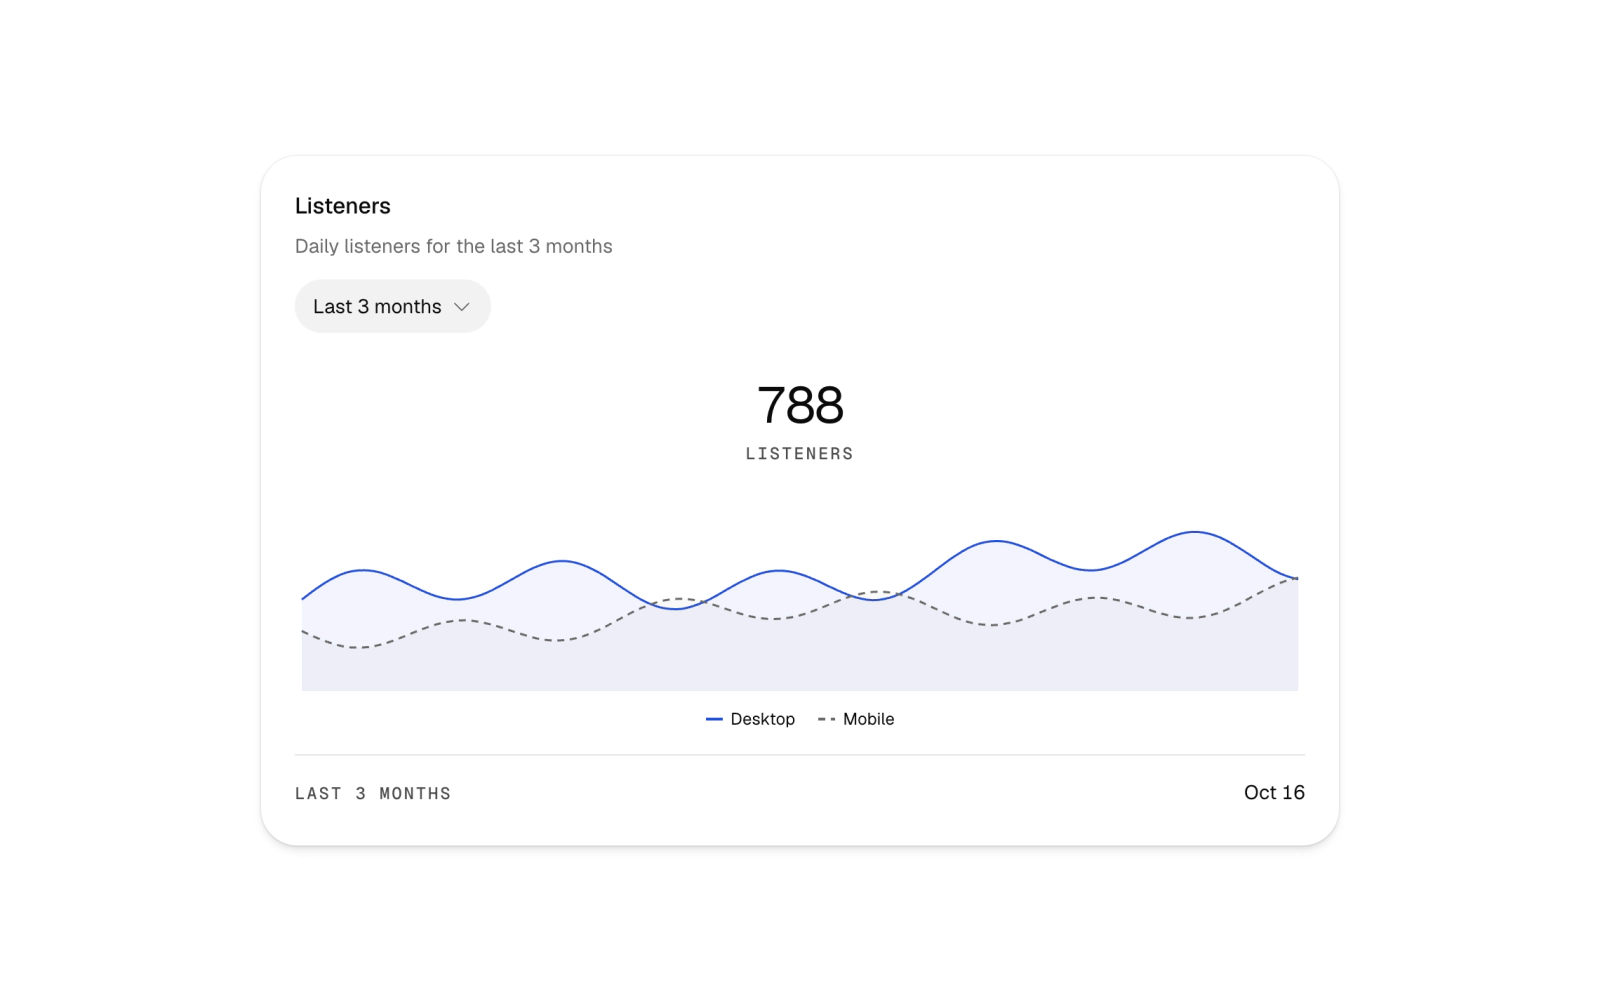
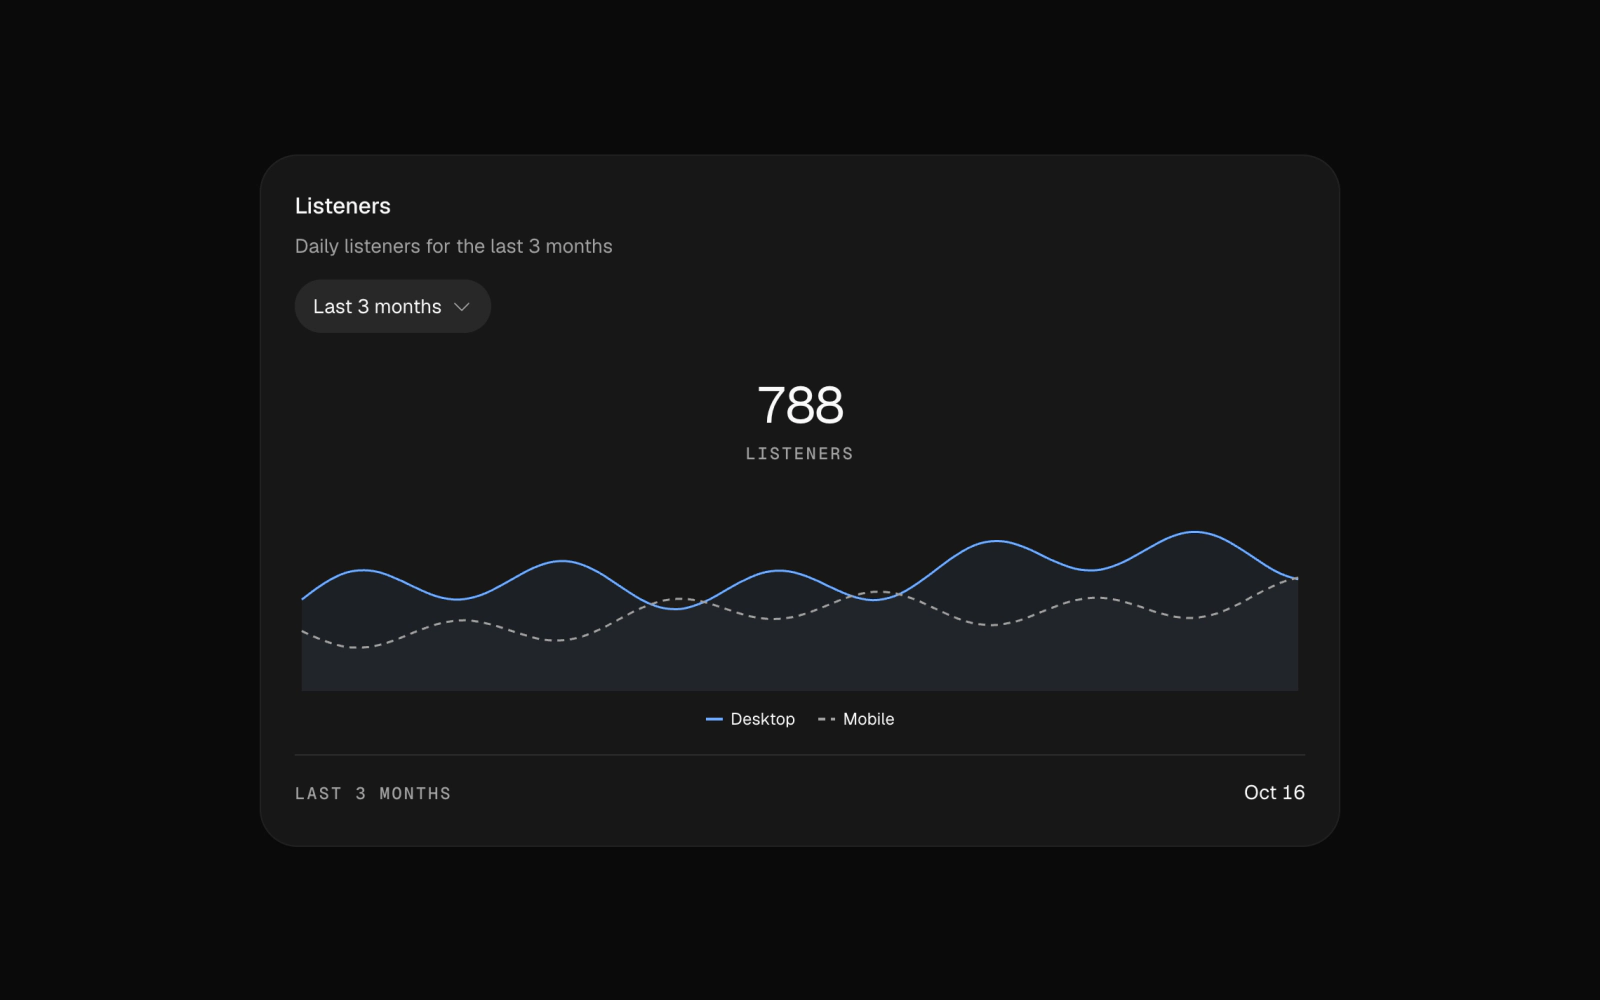
Fine area chart for dashboards: daily listener areas with thin orange and dashed gray lines, light fills, a date range control and a ruled mono caption.
Fine Listening Profile
radar-chart-02
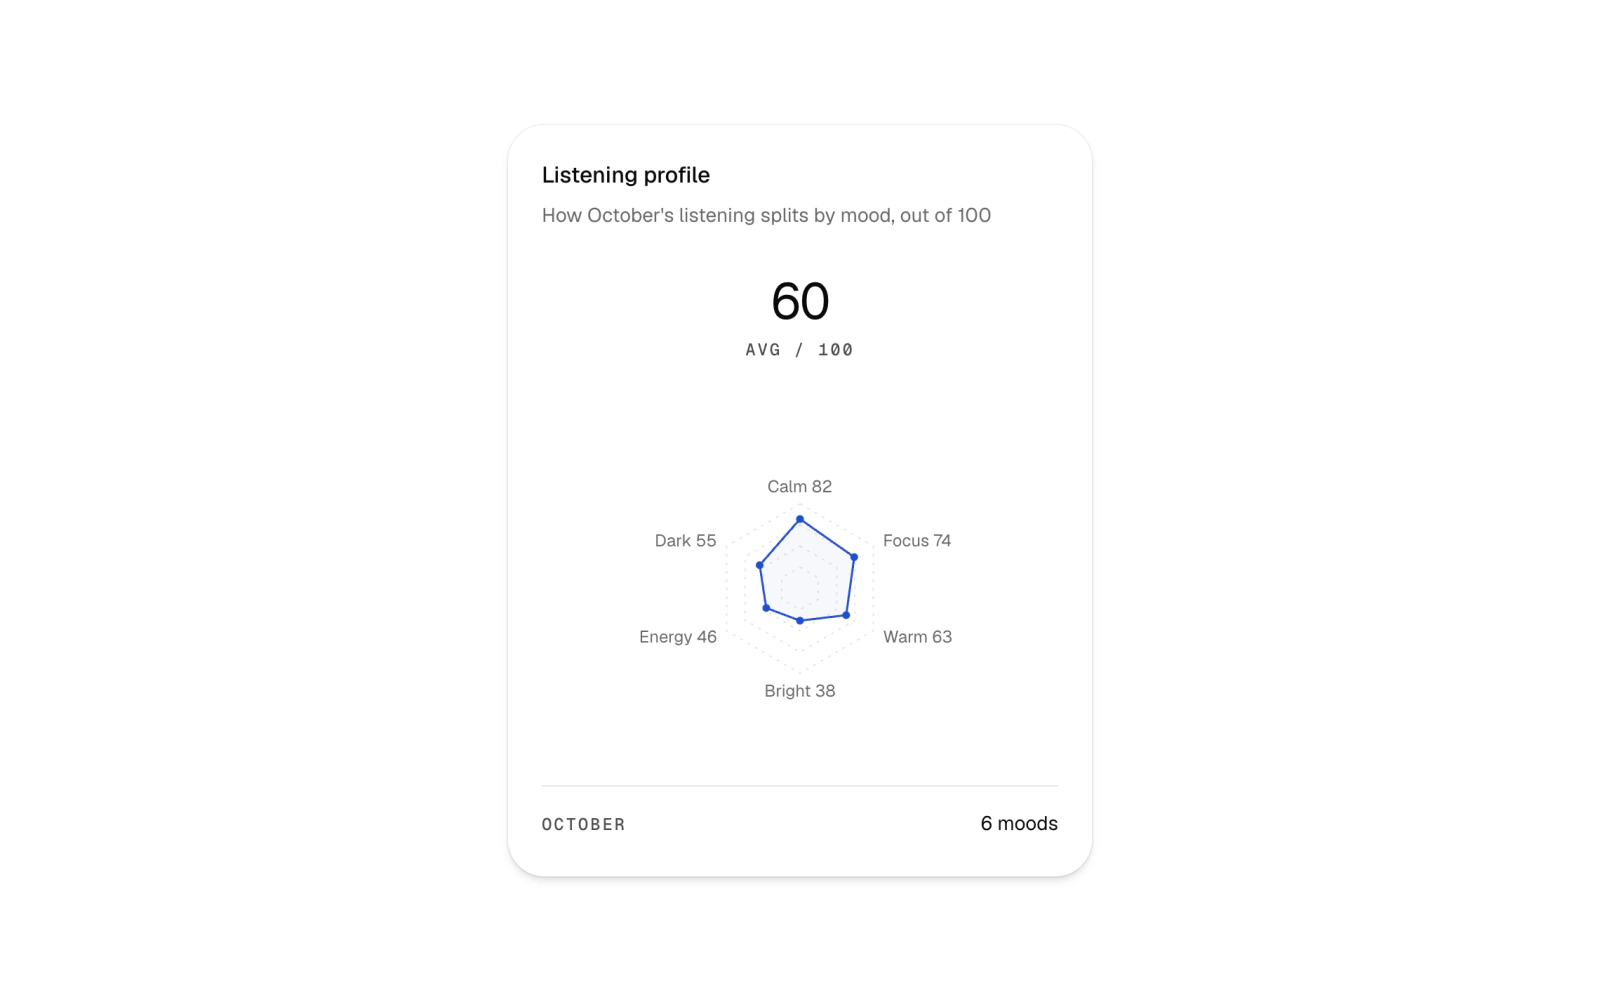
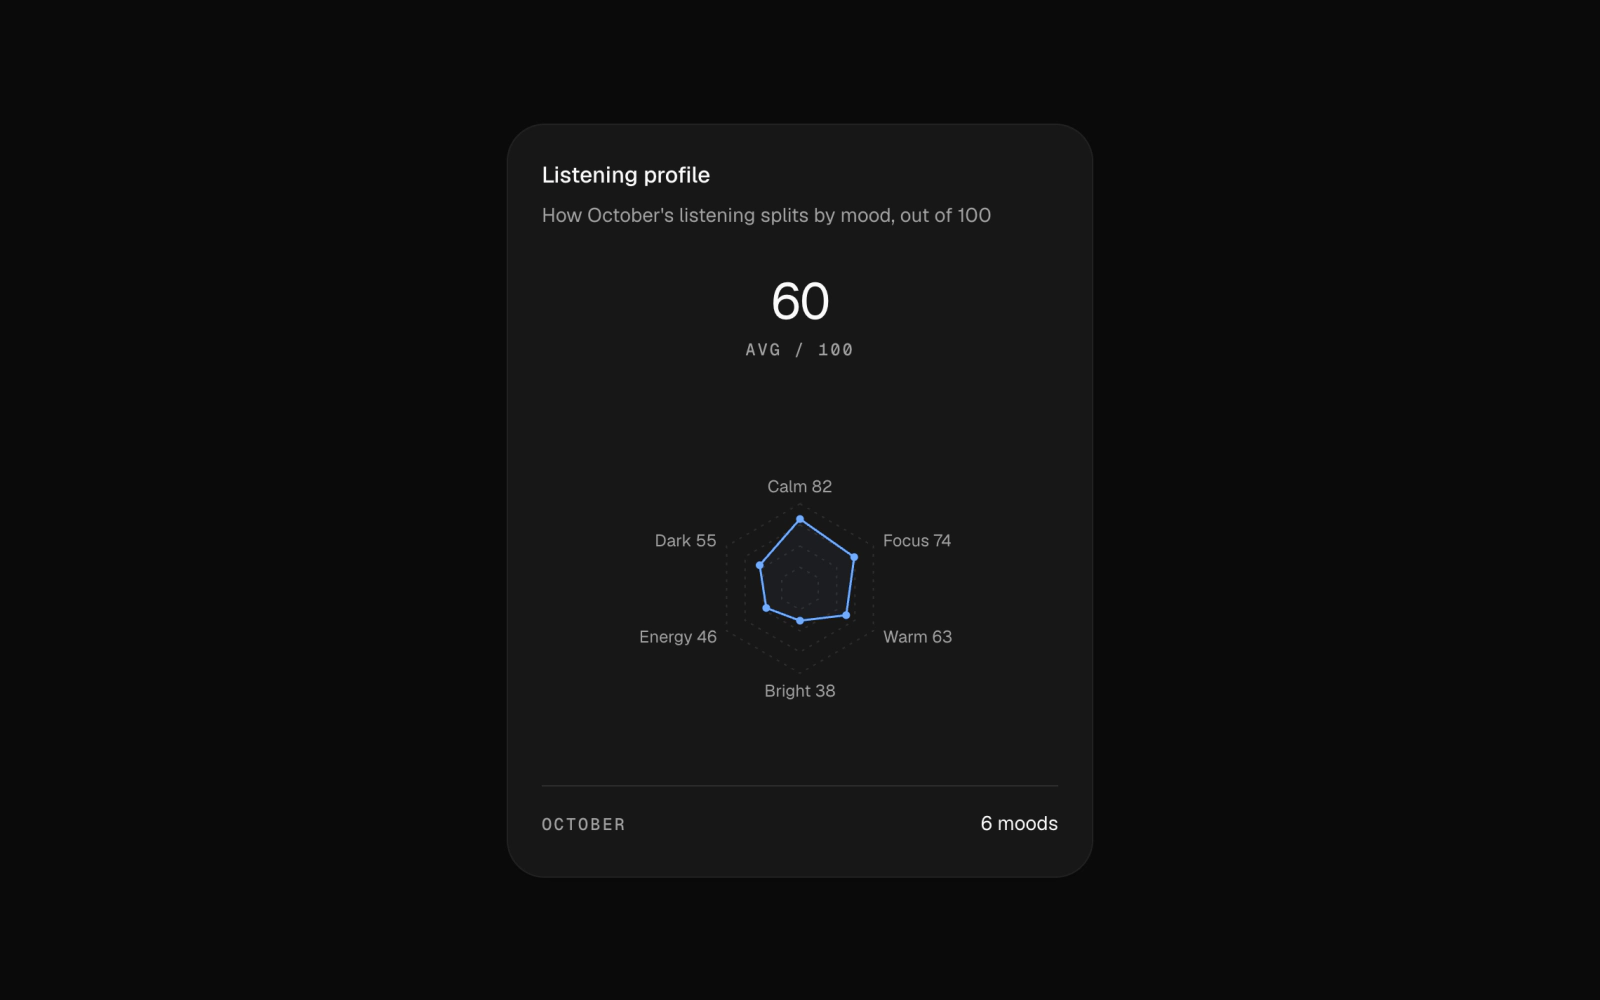
Fine radar chart for dashboards: a thin orange listening-profile outline over a dashed polar grid, with labeled scores and a ruled caption.
Fine Session Bars
bar-chart-04
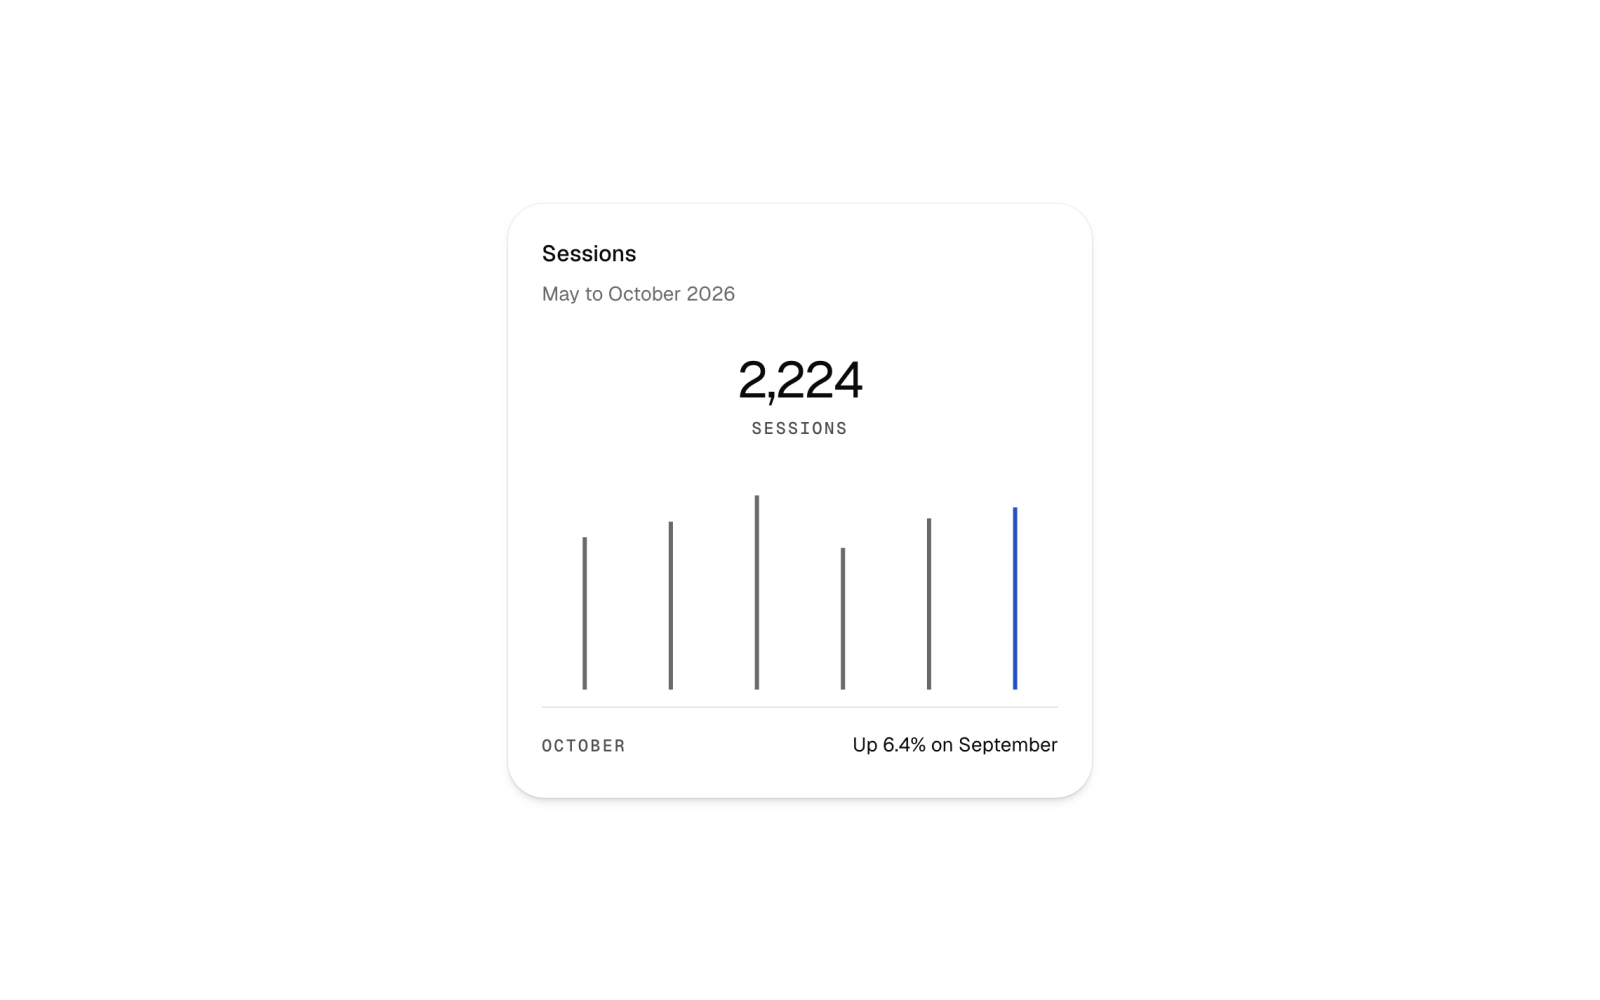
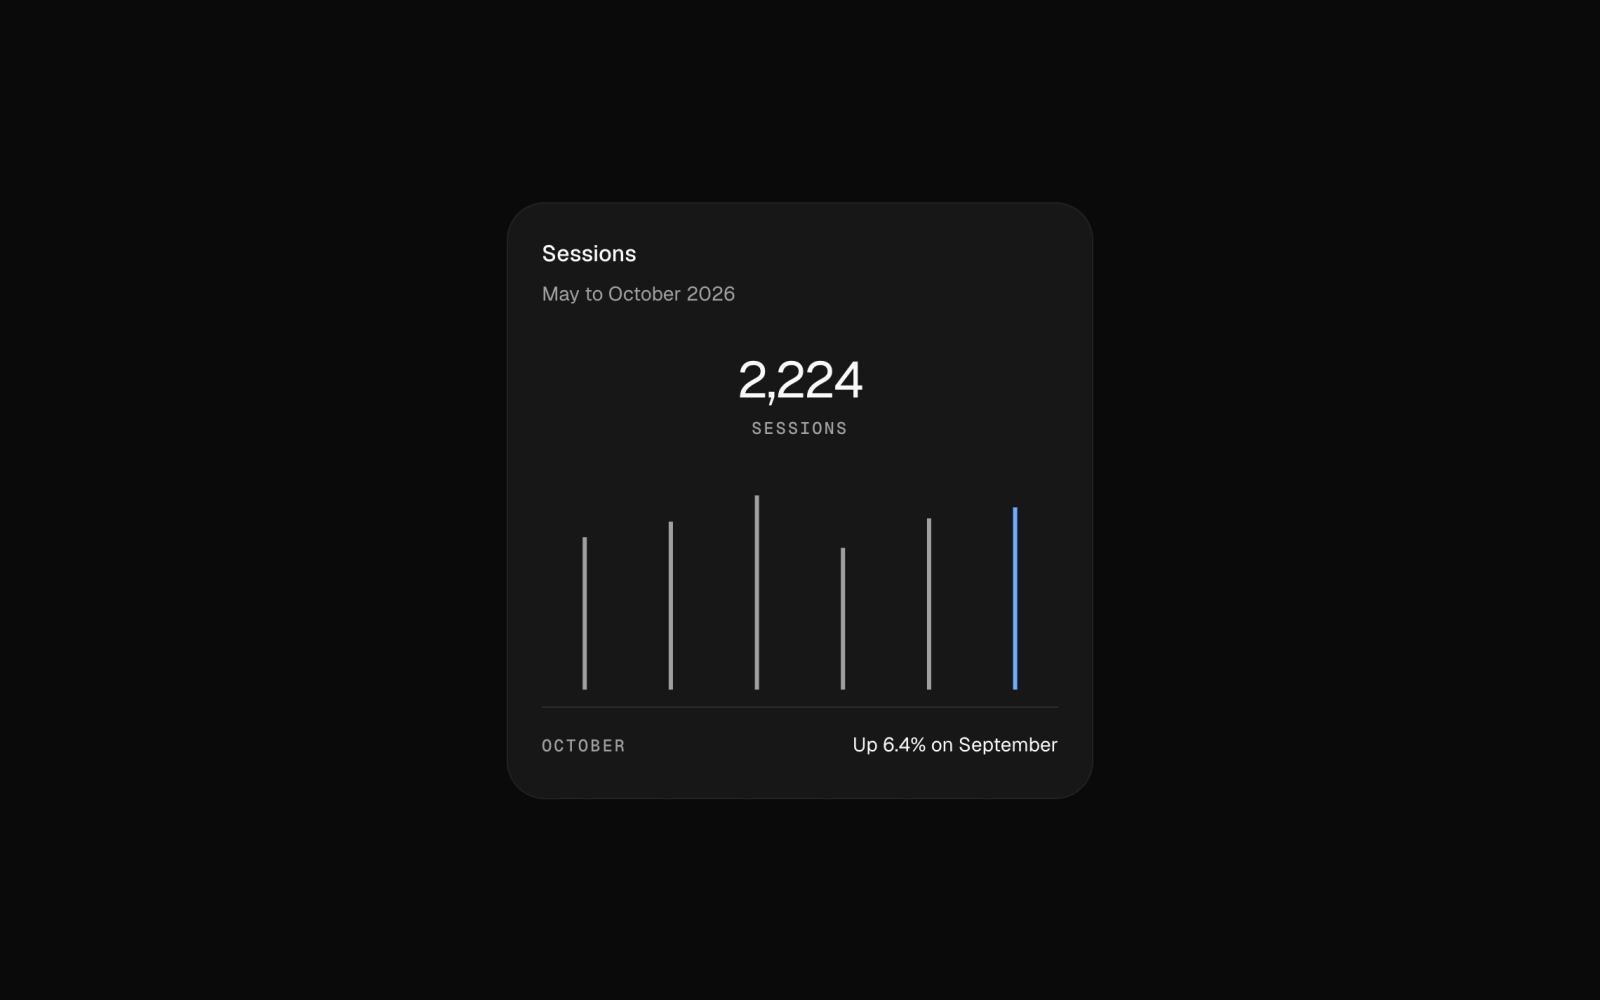
Fine bar chart for dashboards: monthly session bars with the latest month in orange, a large current value and a ruled mono caption.
Fine Session Line
line-chart-02
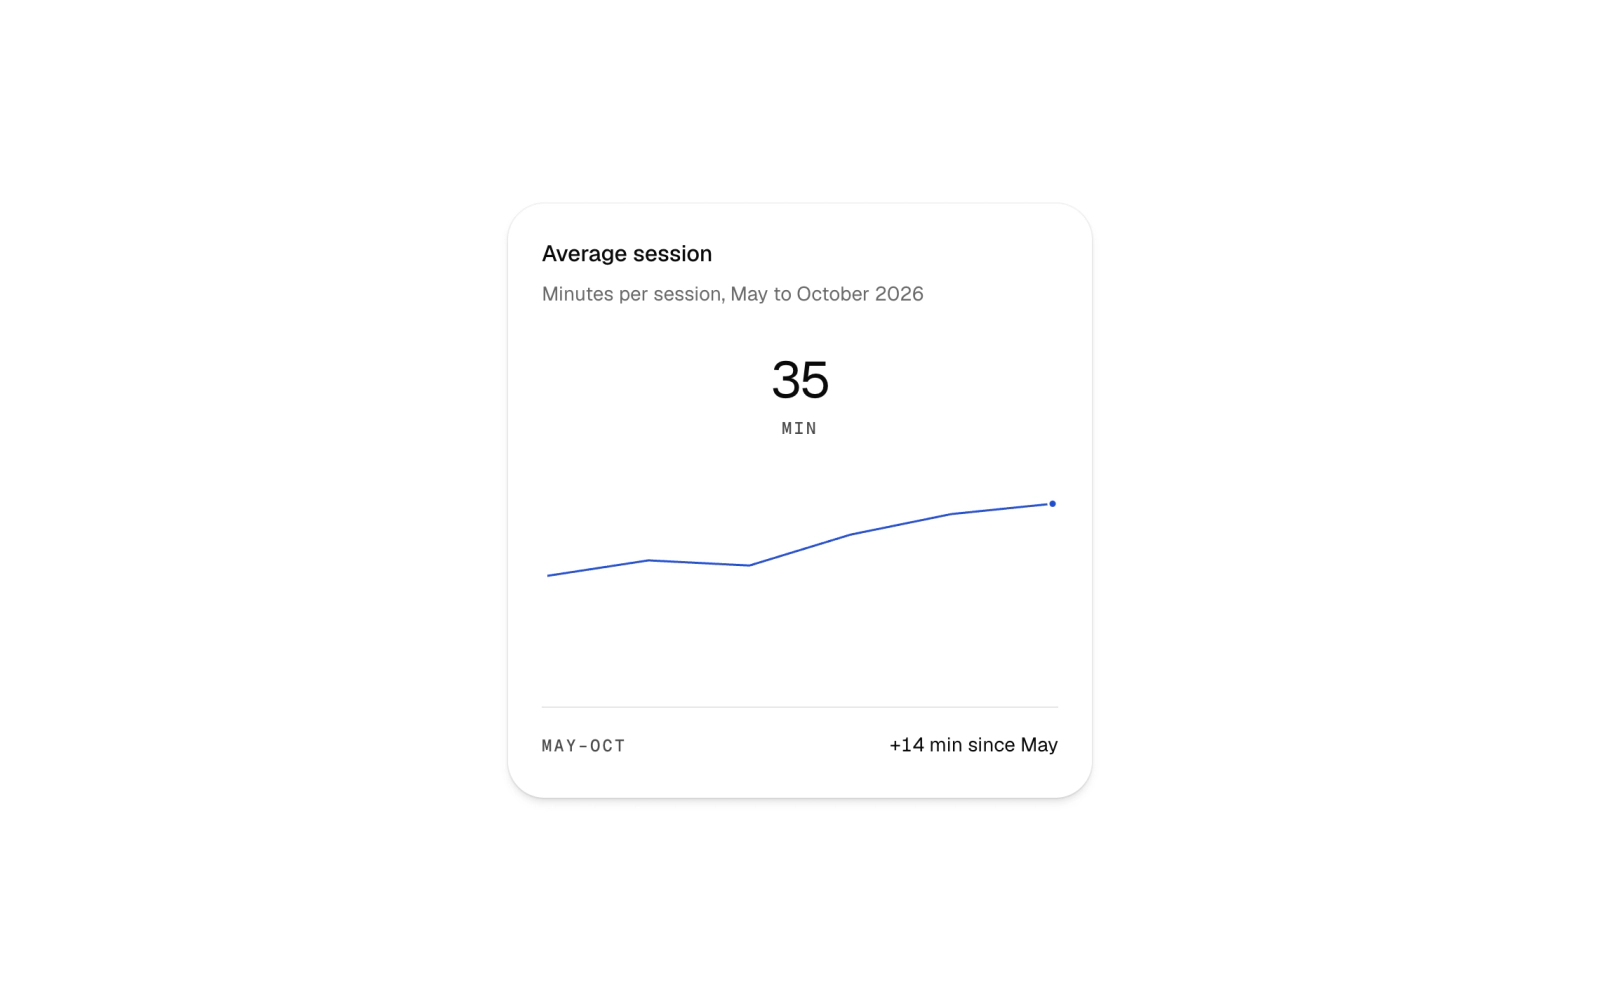
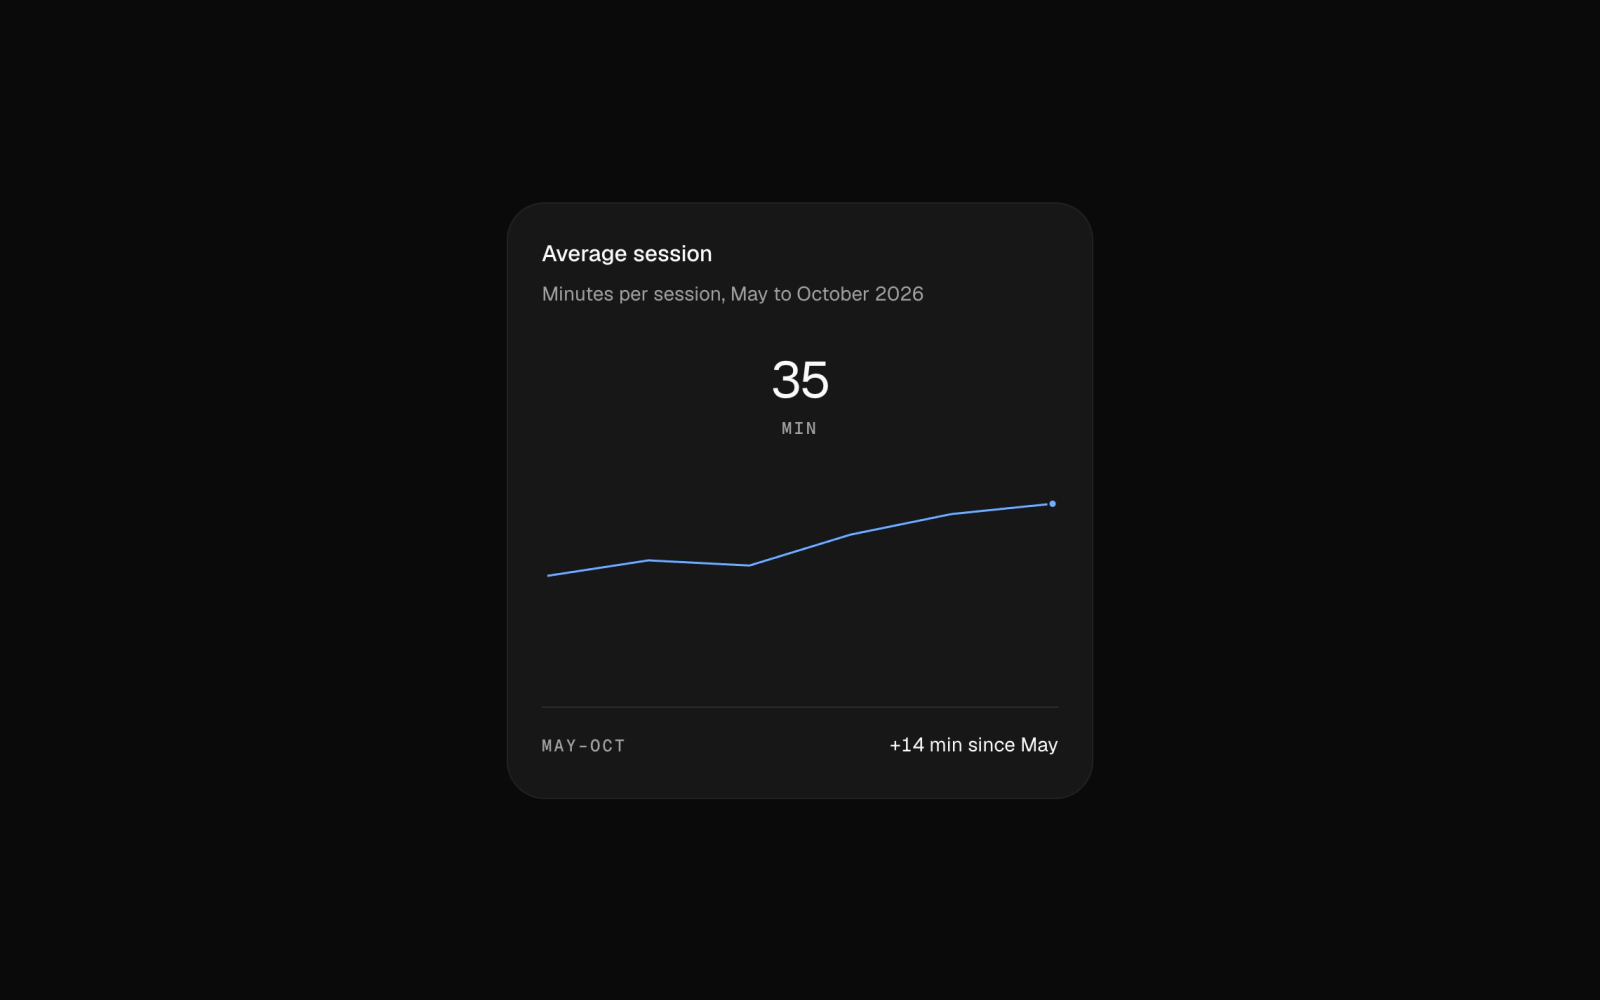
Fine line chart for dashboards: a thin orange session-length line with a marked endpoint, current value and ruled mono caption.
Fine Traffic Lines
traffic-overview-02
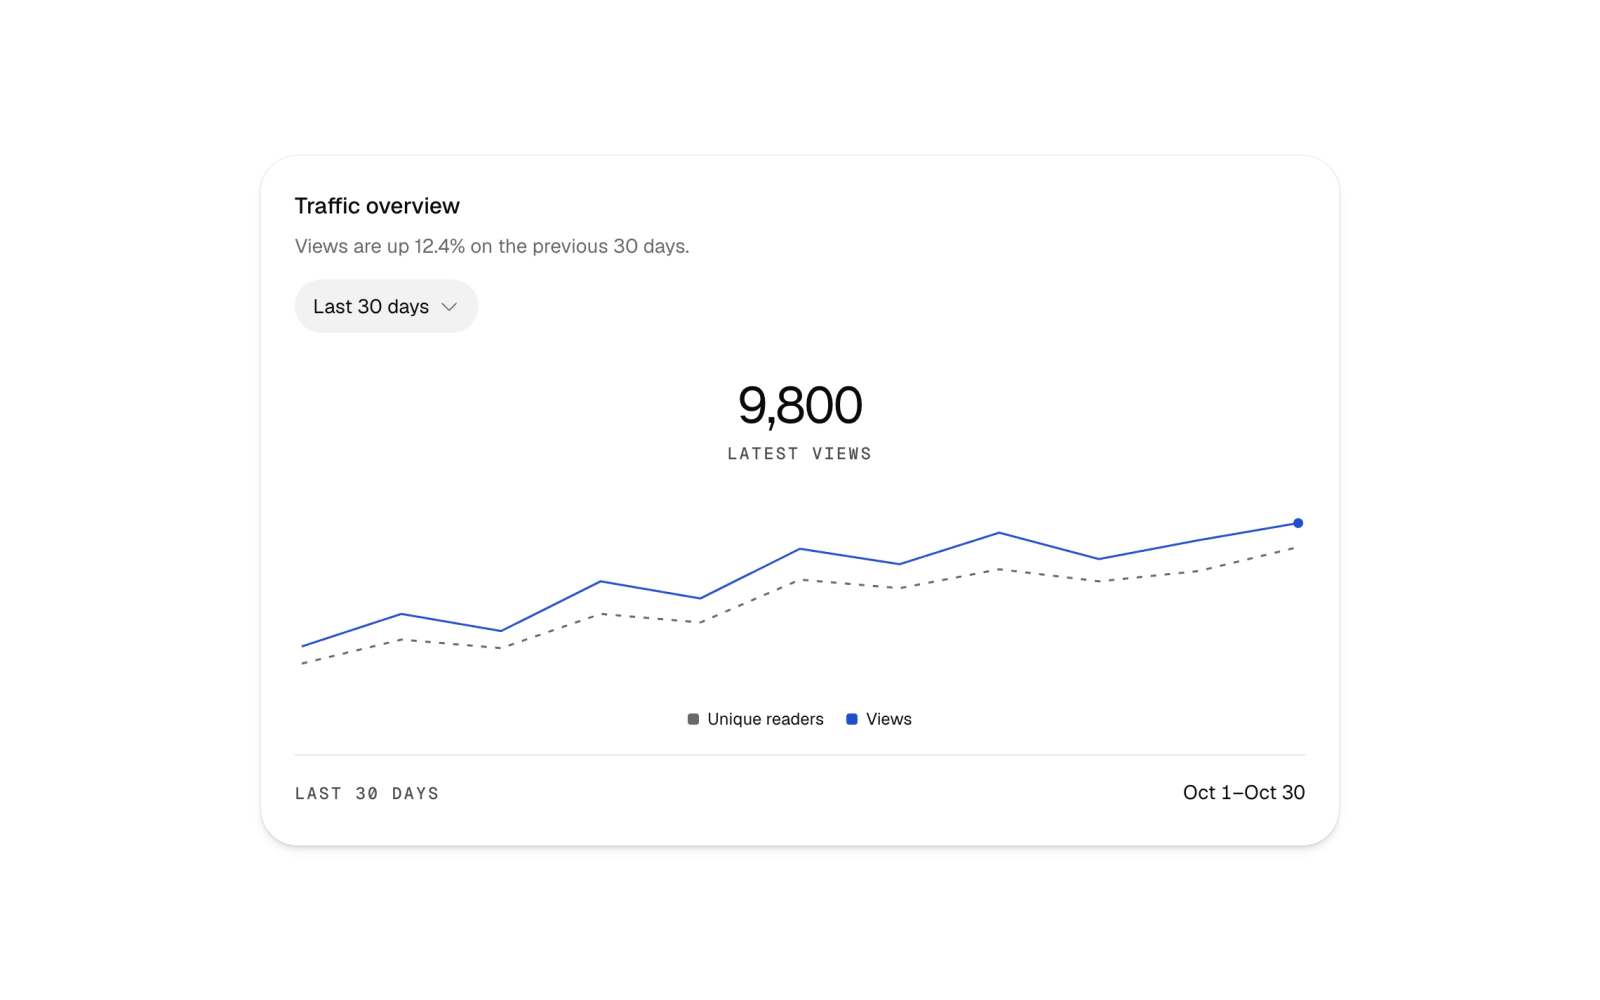
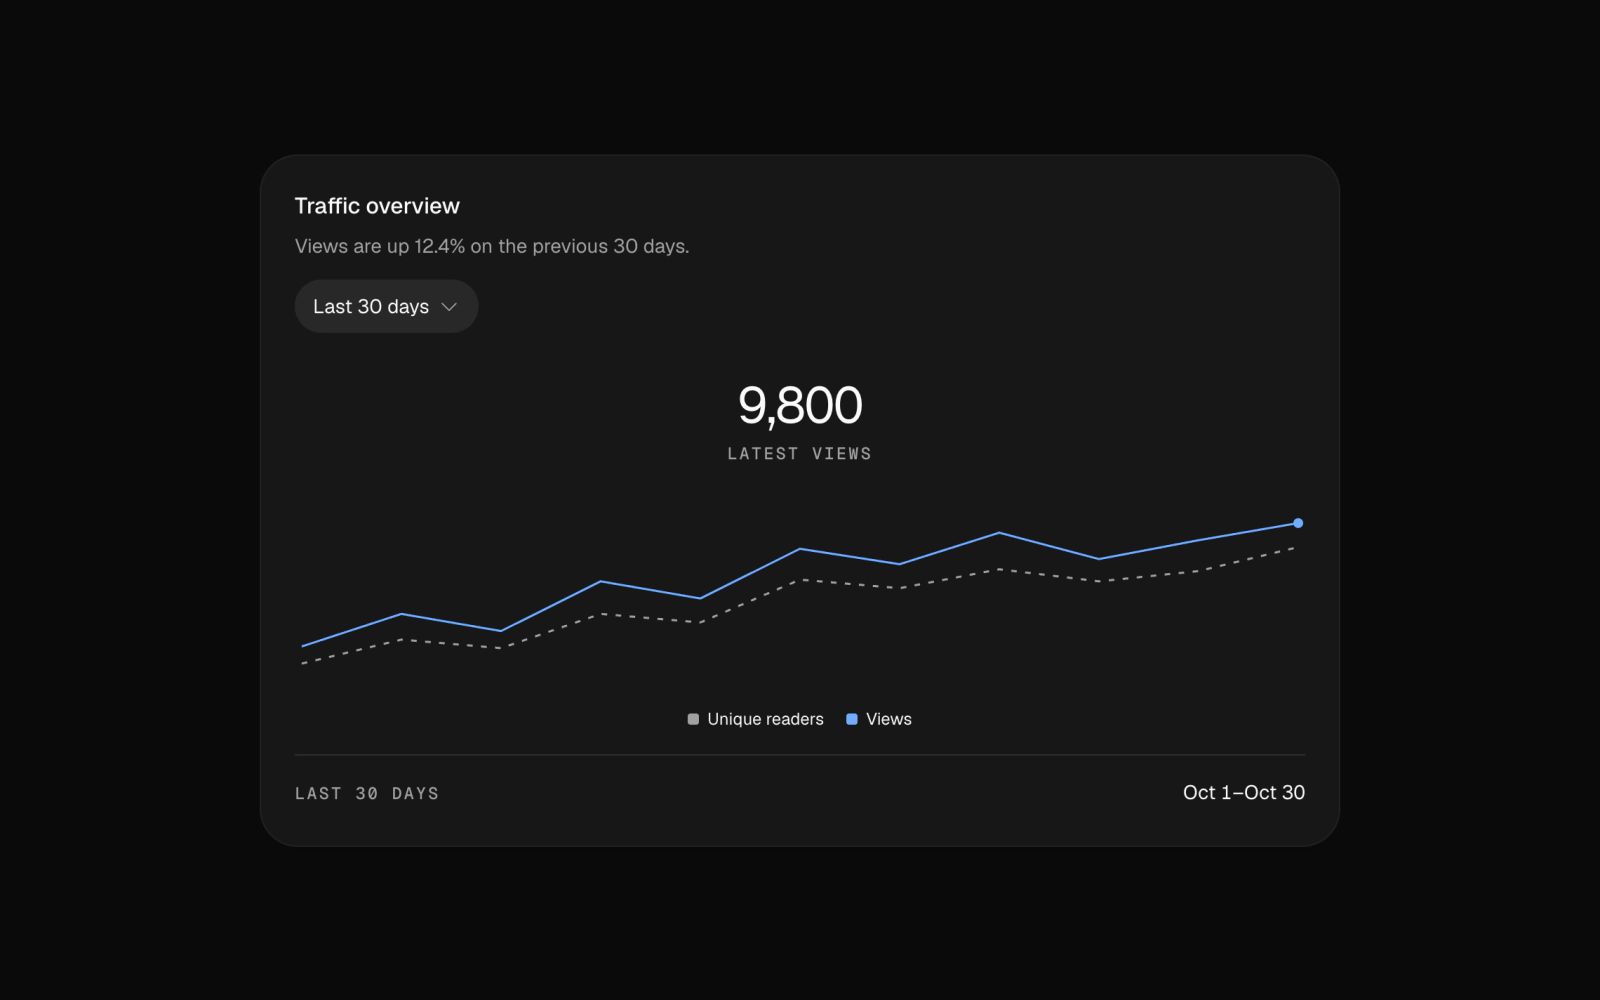
Fine website traffic line chart for dashboards: orange views and dashed gray reader lines, with a current value, date range control and ruled mono caption.
Fine Weekly Change
bar-chart-06
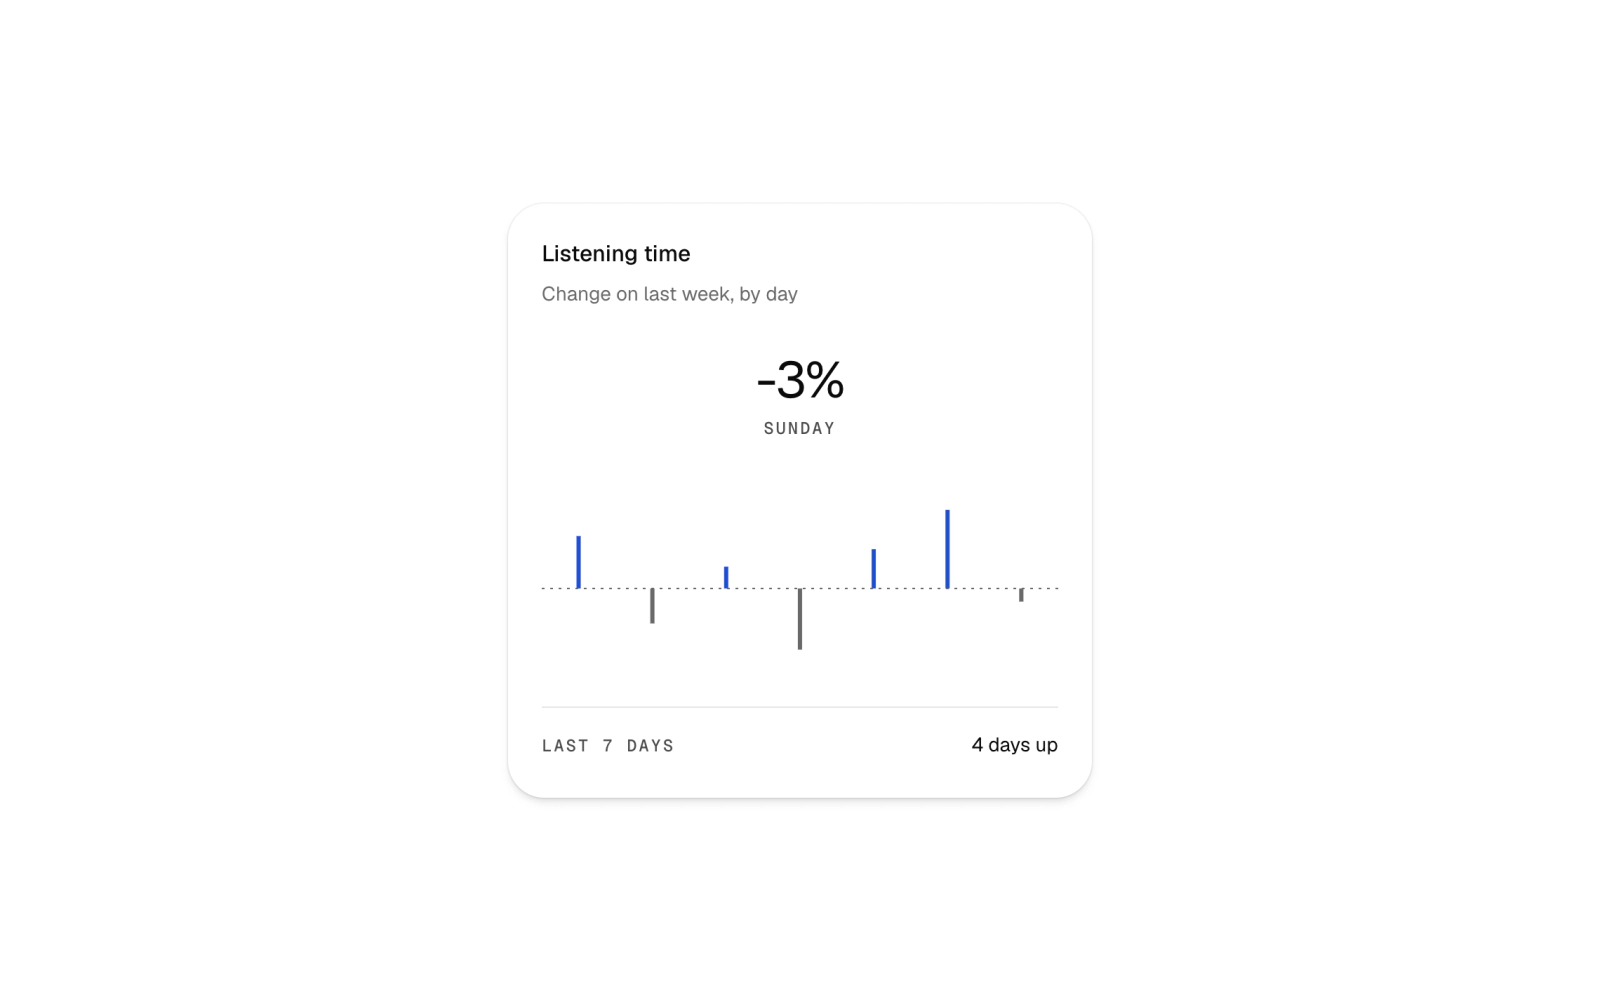
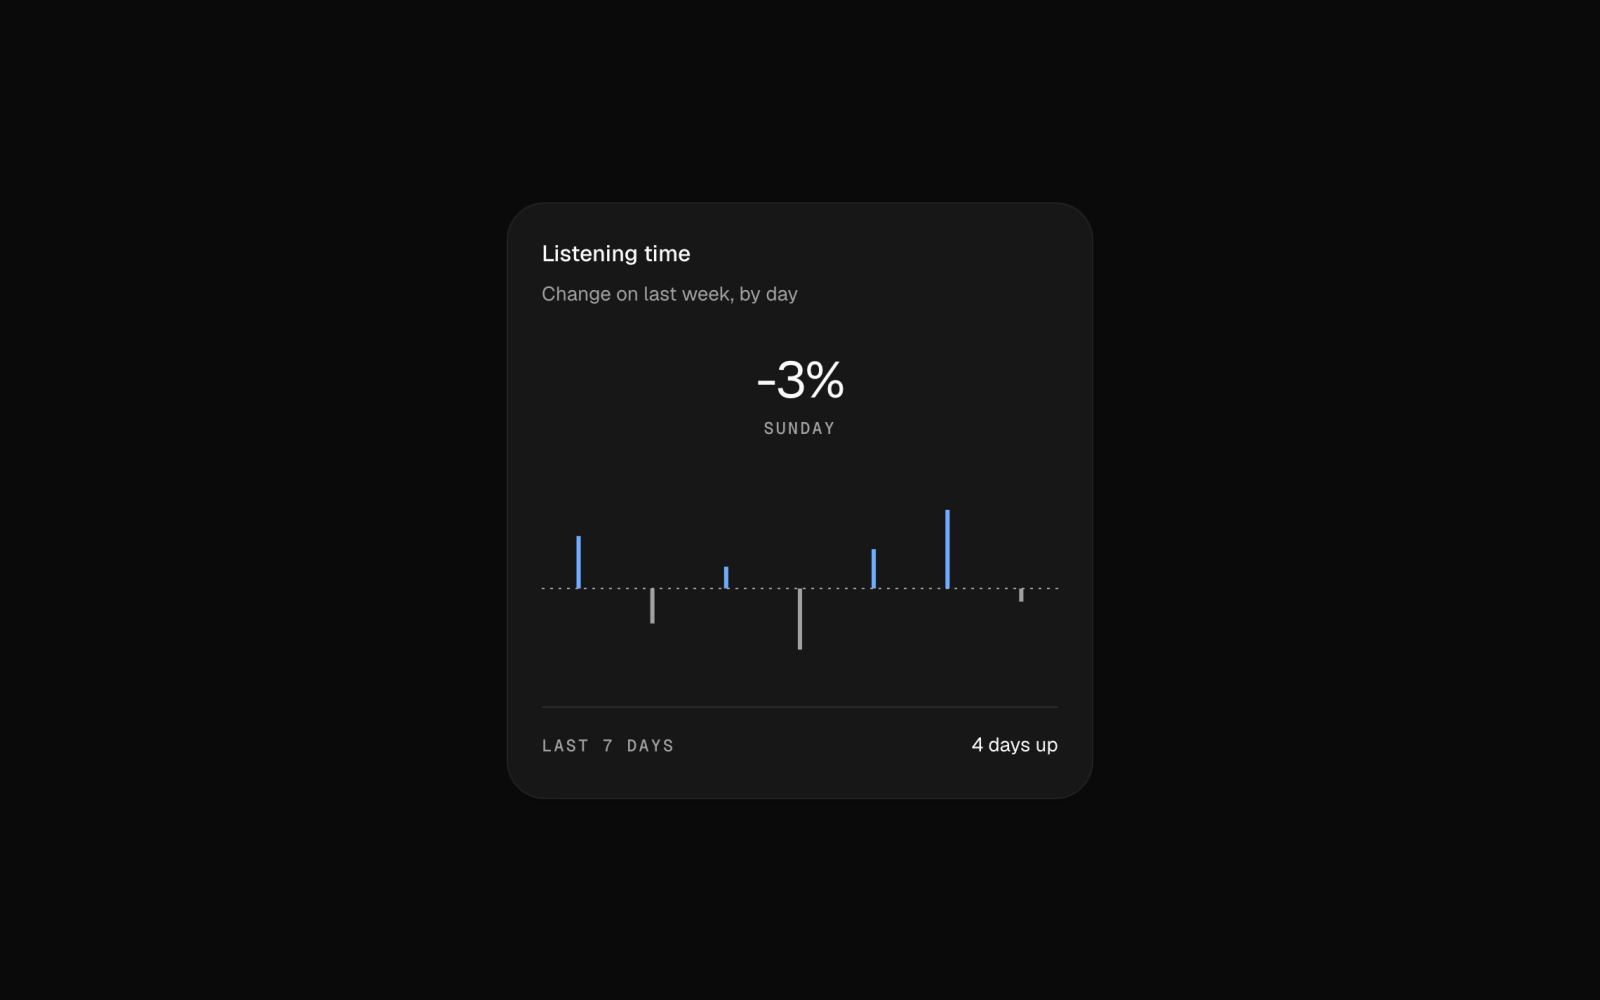
Fine positive and negative bar chart for dashboards: listening-time bars with a dashed zero line, signed tooltip values and a weekly summary.
Frost Column Bars
bar-chart-09
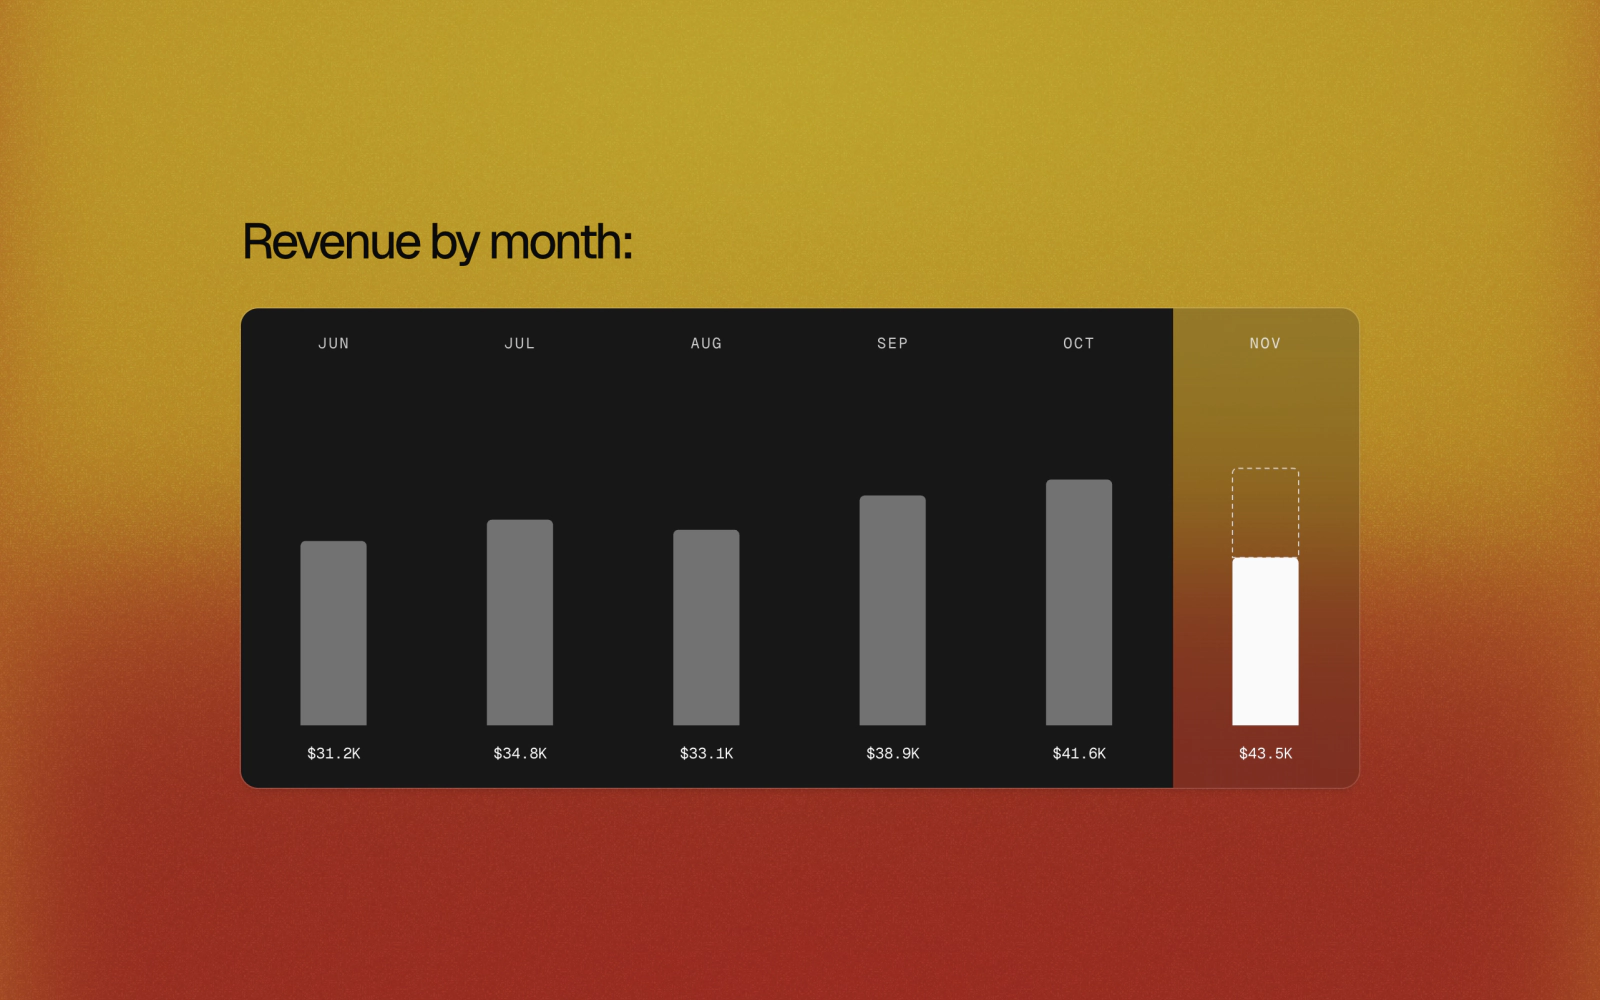
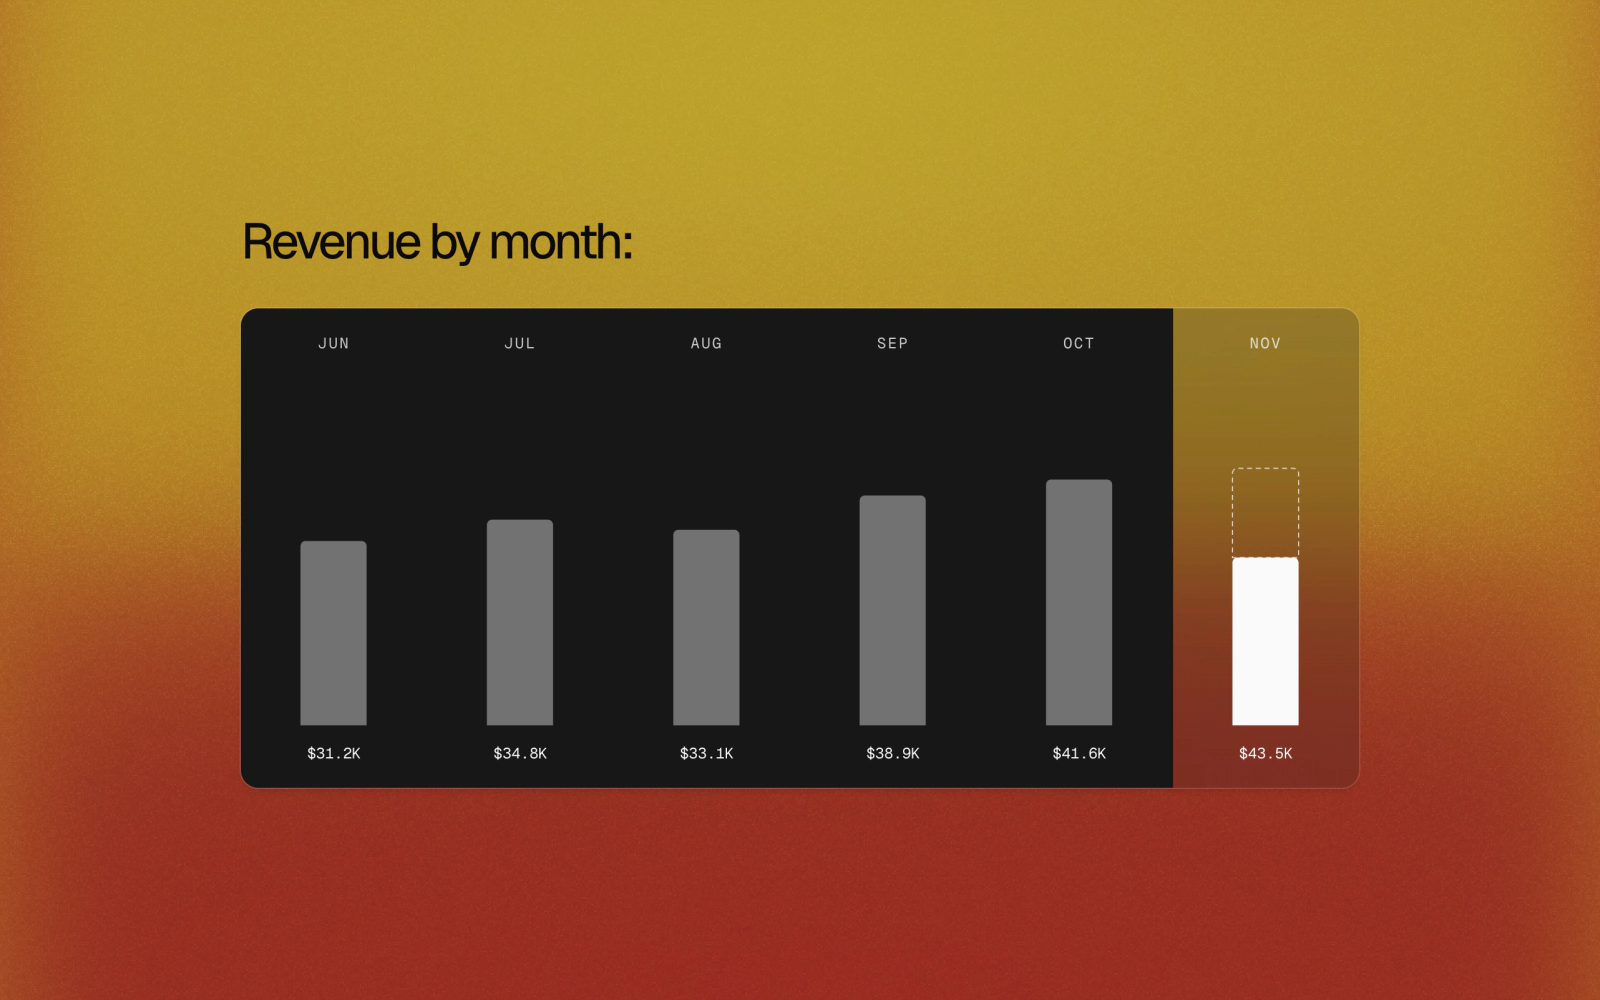
Monthly revenue bars on a warm grained wash: finished months sit quietly on a dark card, and the month in progress is a frosted glass column with a solid bar and a dashed projection. Mono month labels and totals.
Frost Trend Table
line-chart-05
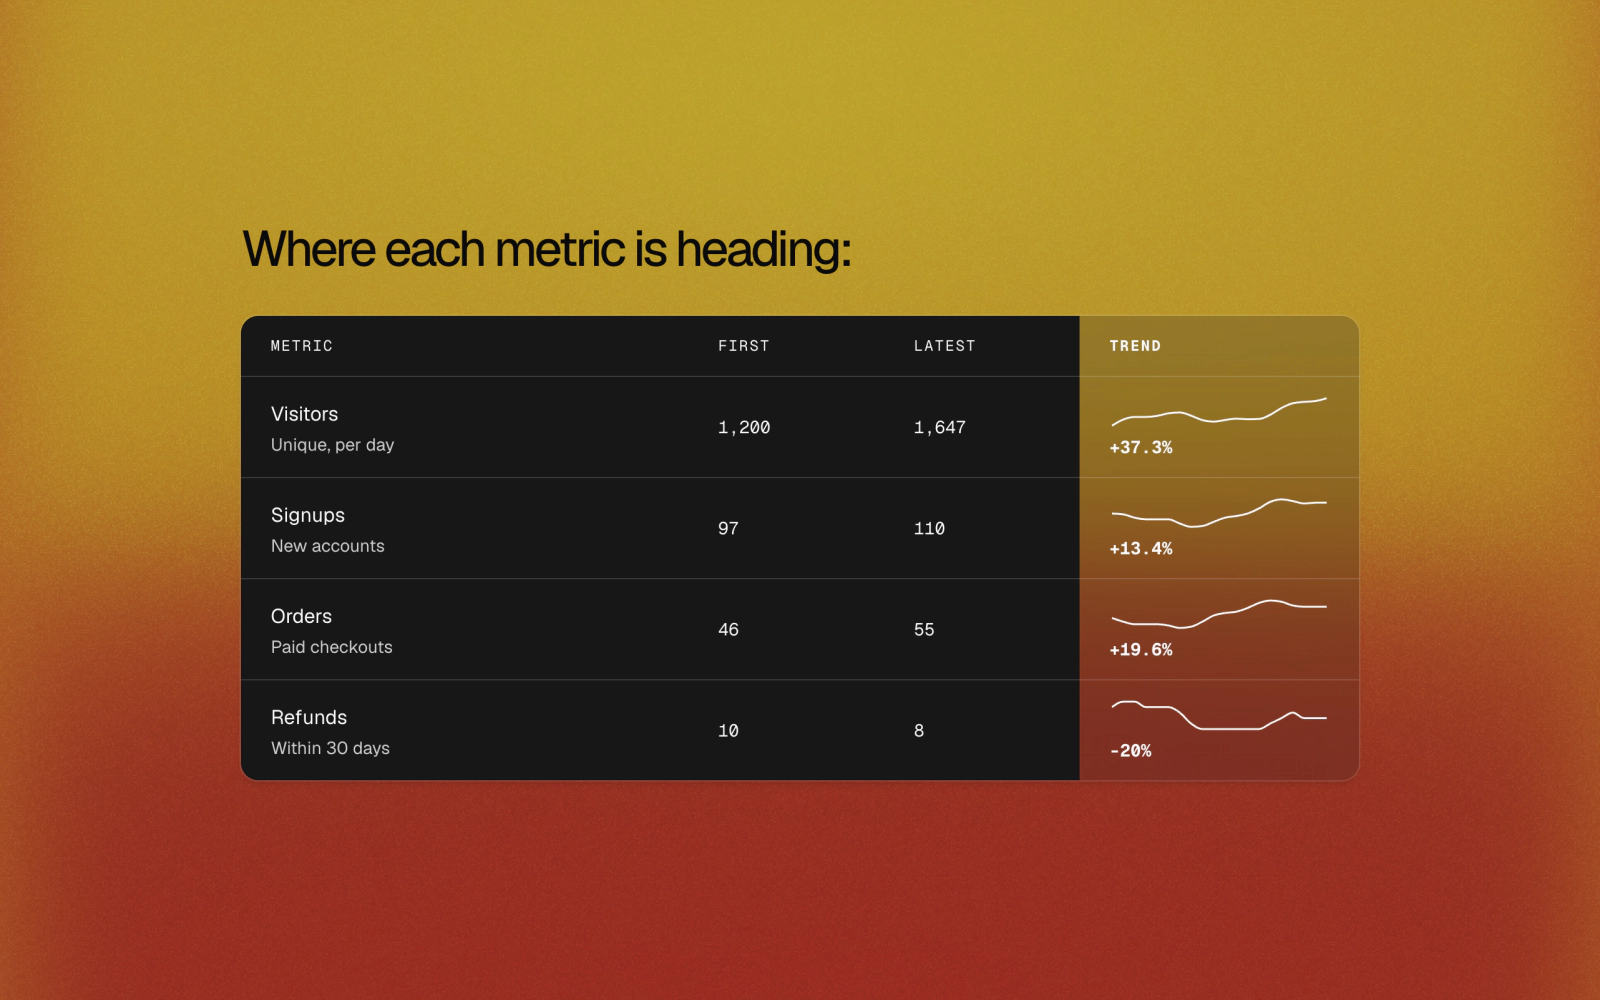
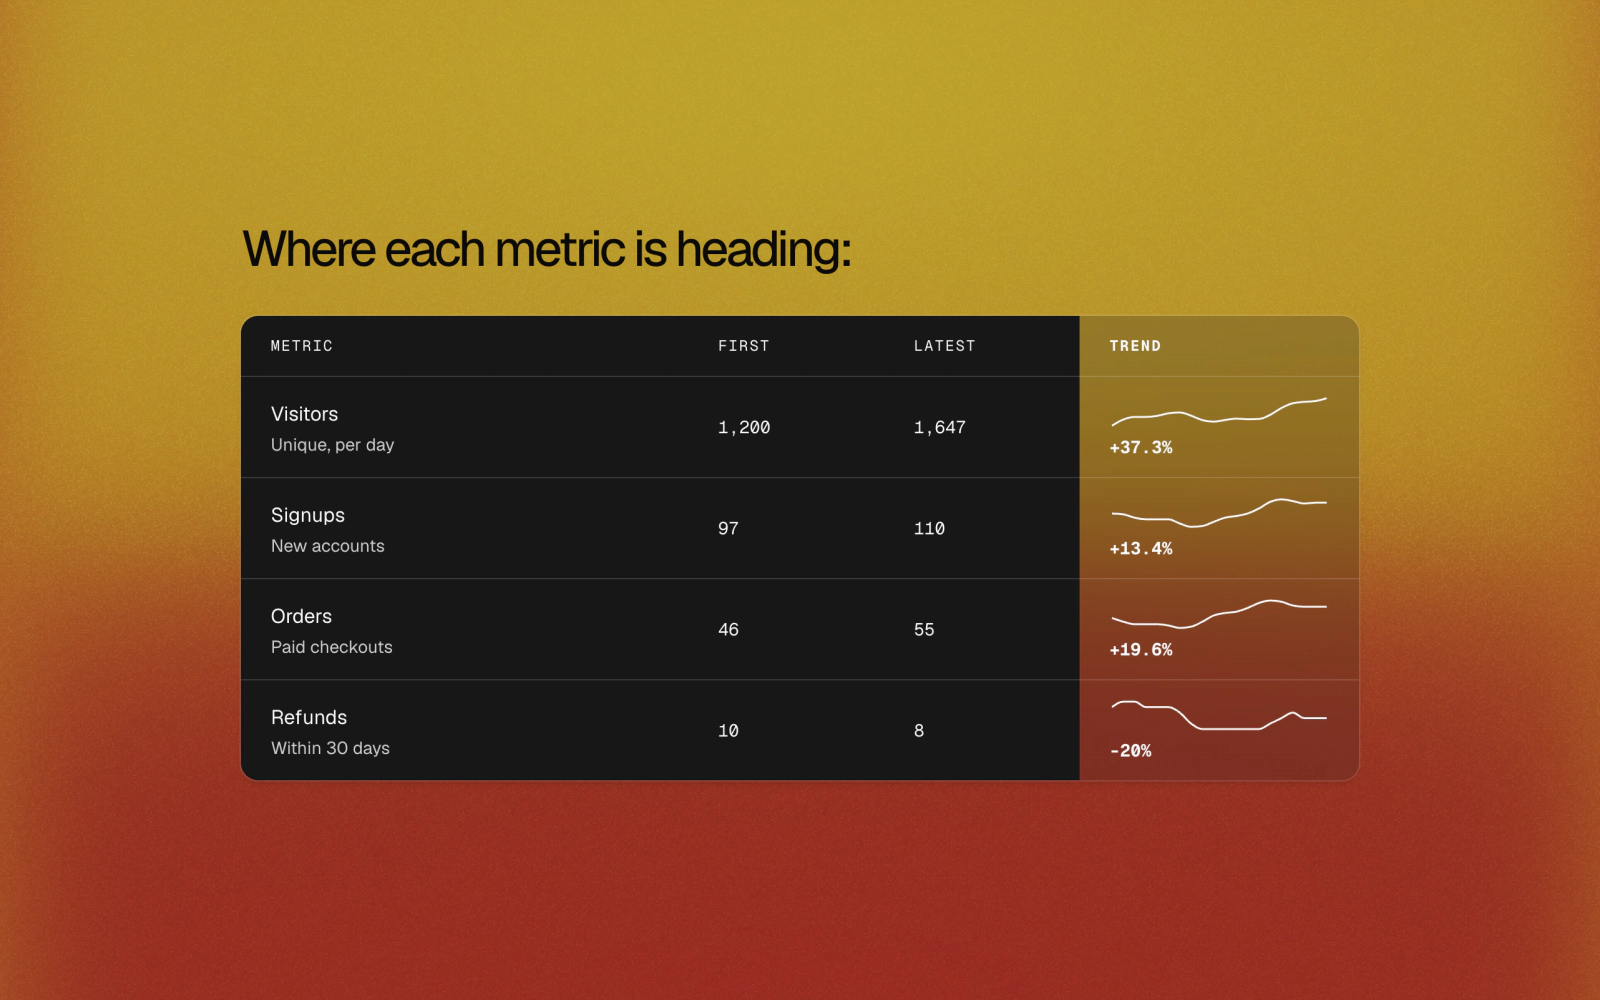
Comparison table of metrics on a dark card over a warm wash, with a frosted last column holding a small trend line and the change in bold. Mono figures, scrolls sideways on phones.
Glass Pill Bars
bar-chart-11
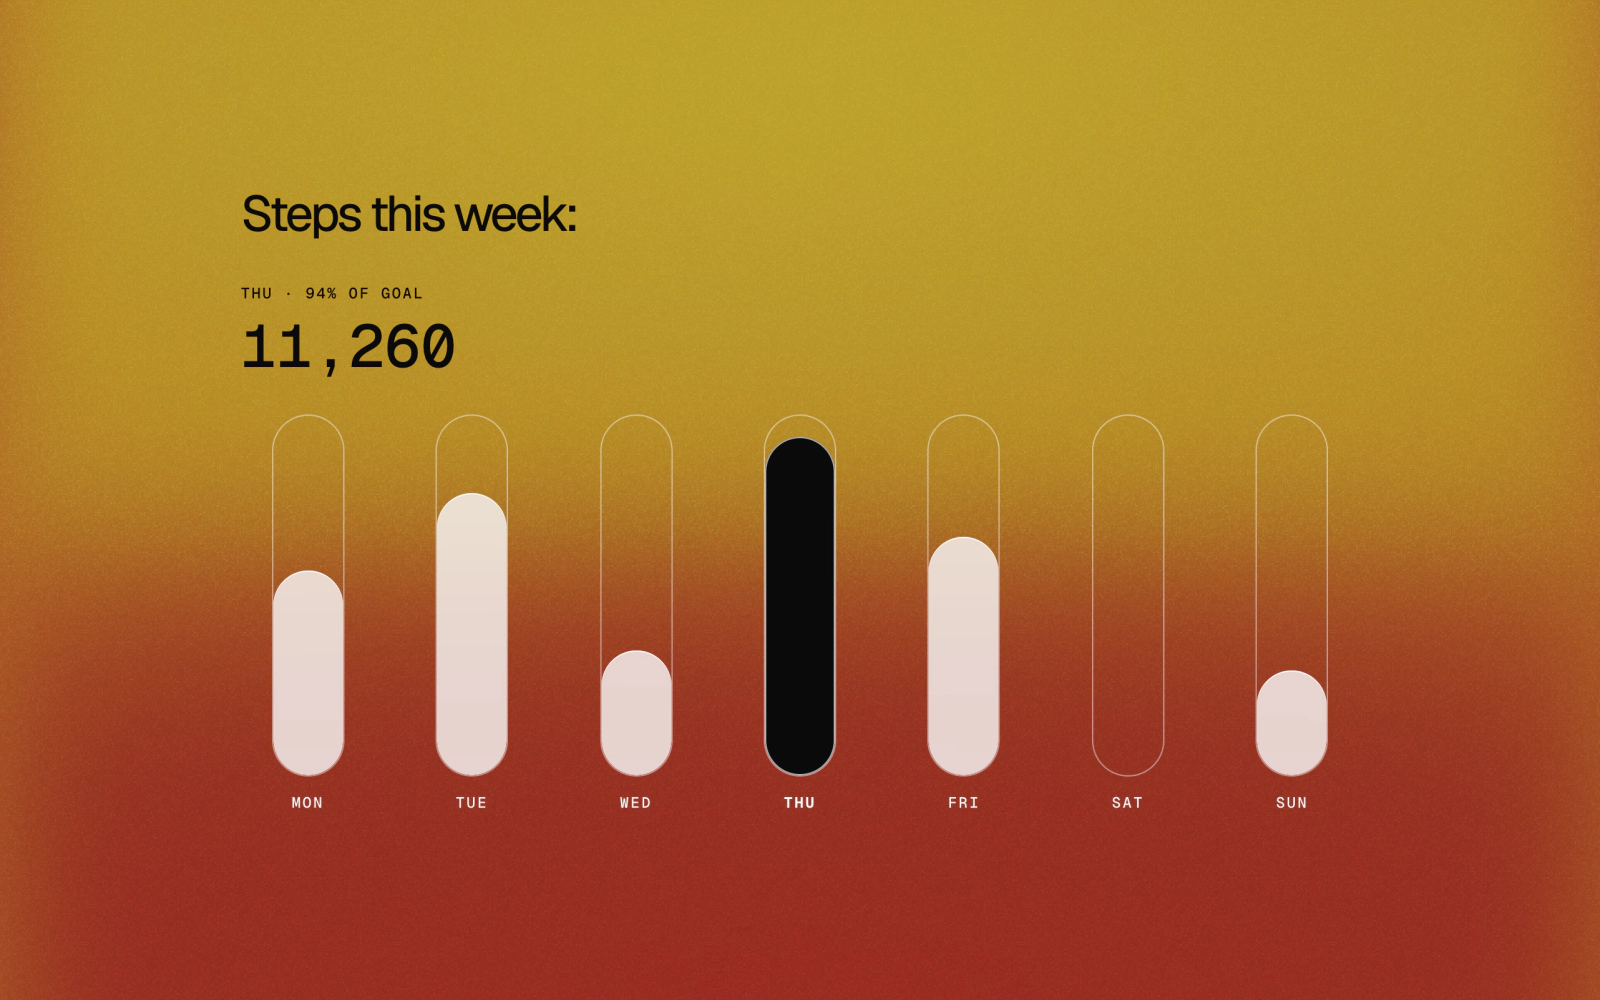
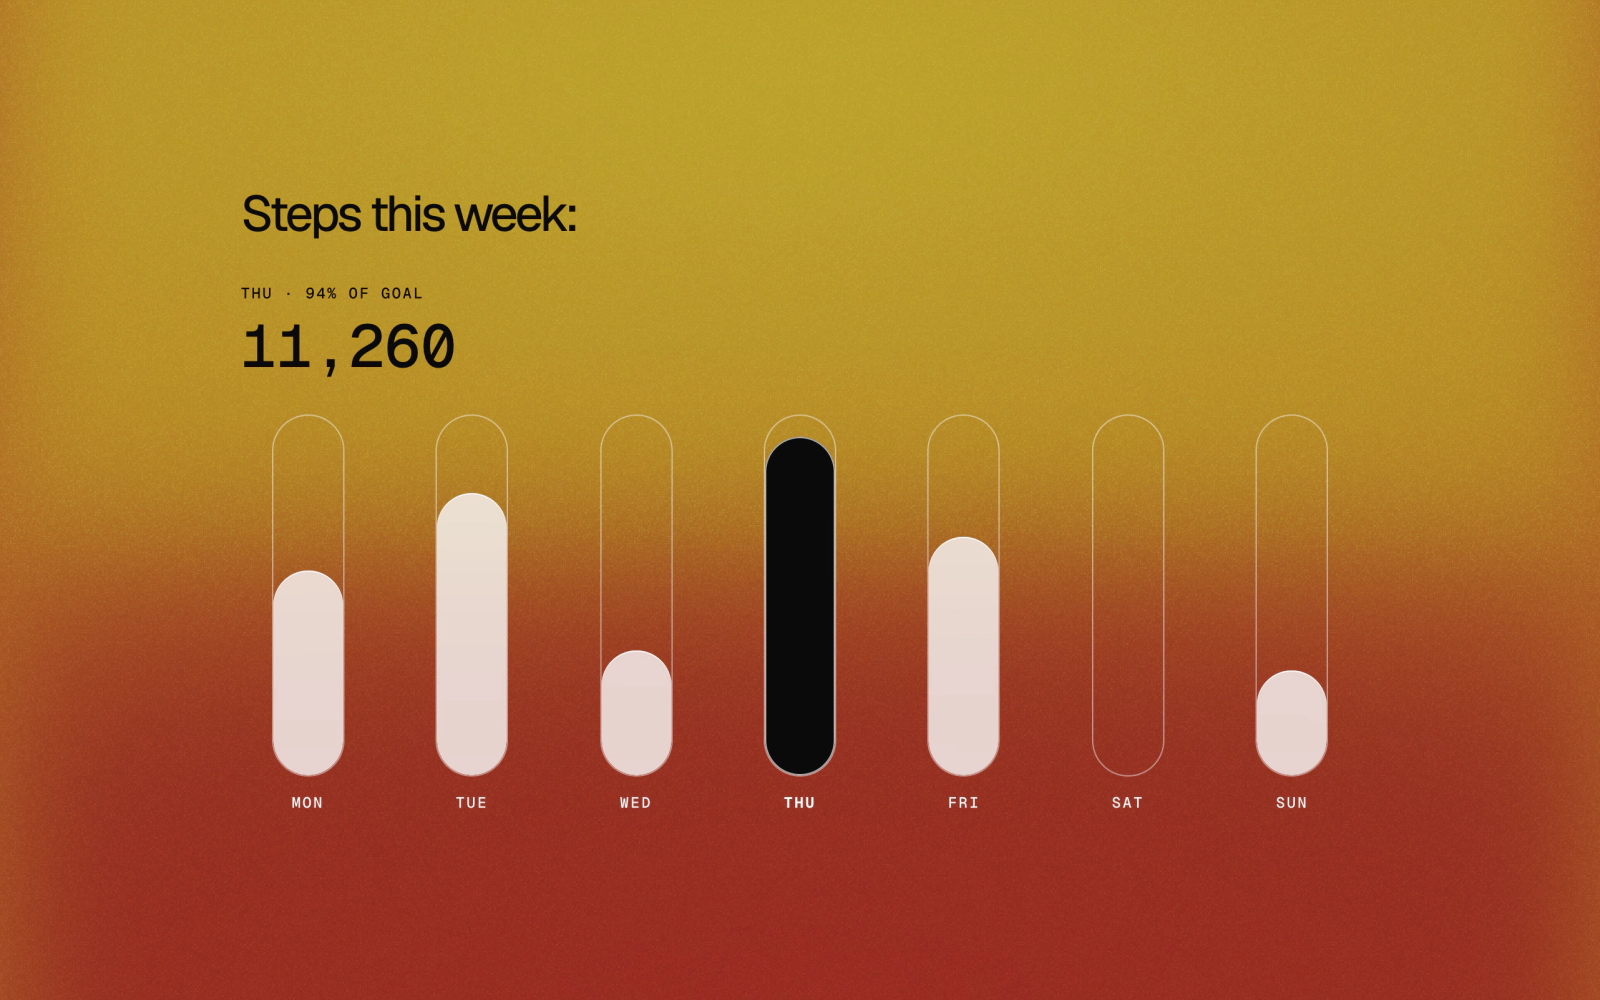
A week of steps straight on a warm wash with no card: milky glass pills in outlined tracks, the day in focus in near-black ink with a light rim, mono day labels and headline figure.
Hatched Partial Period
bar-chart-08
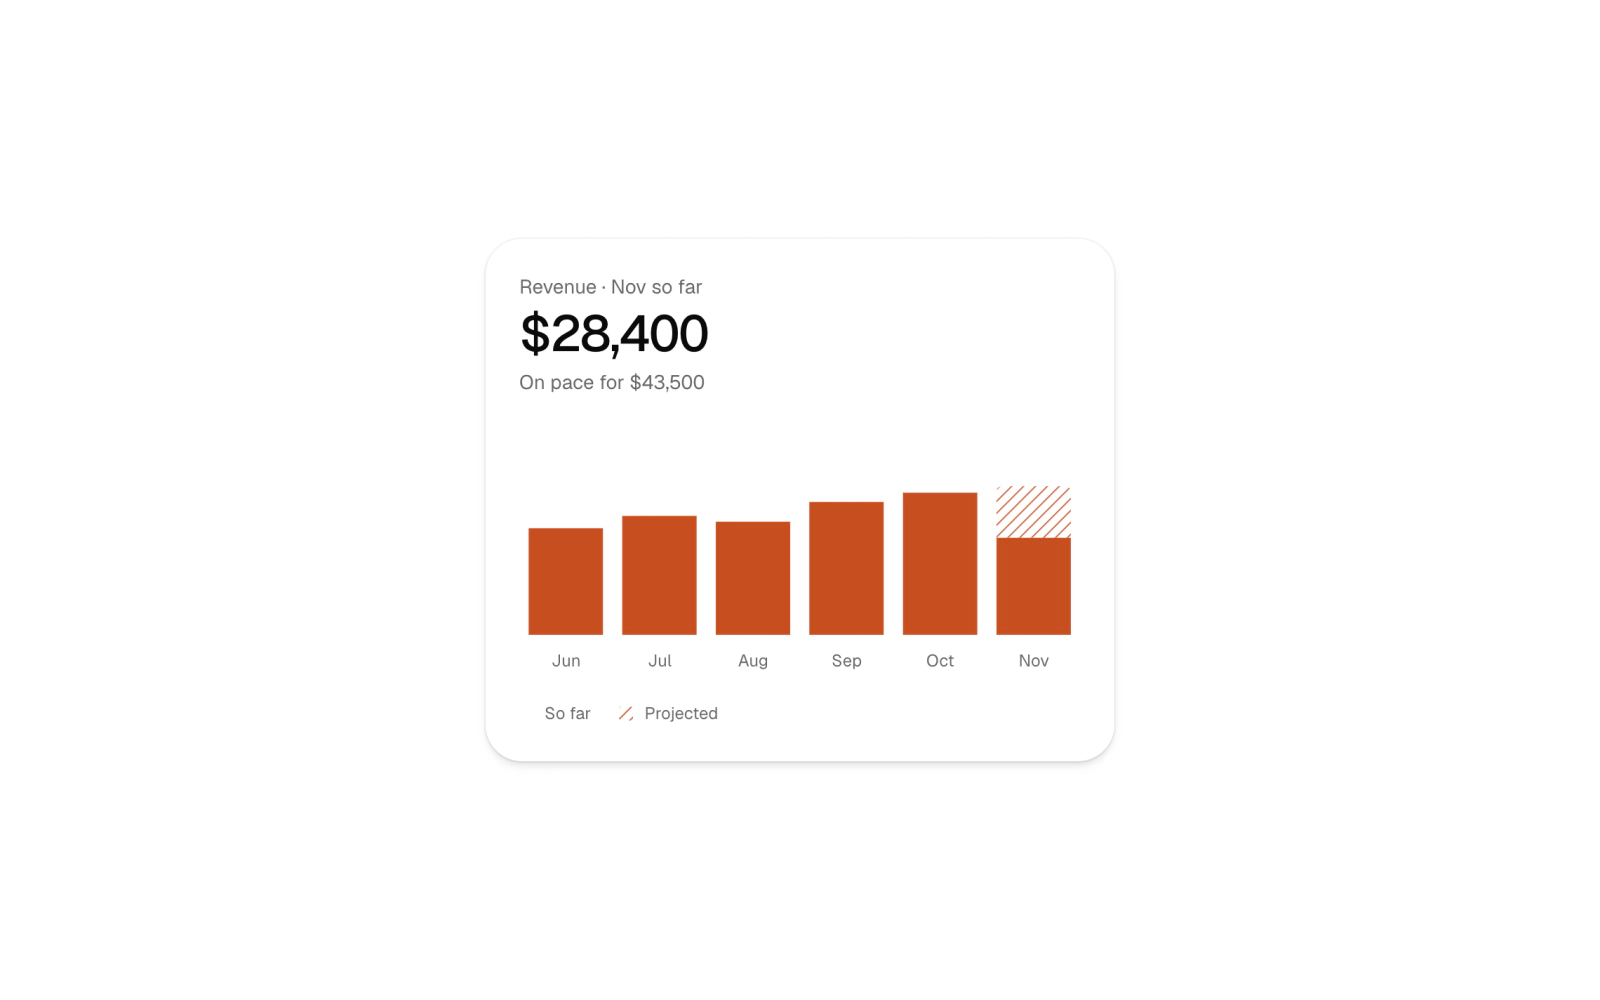
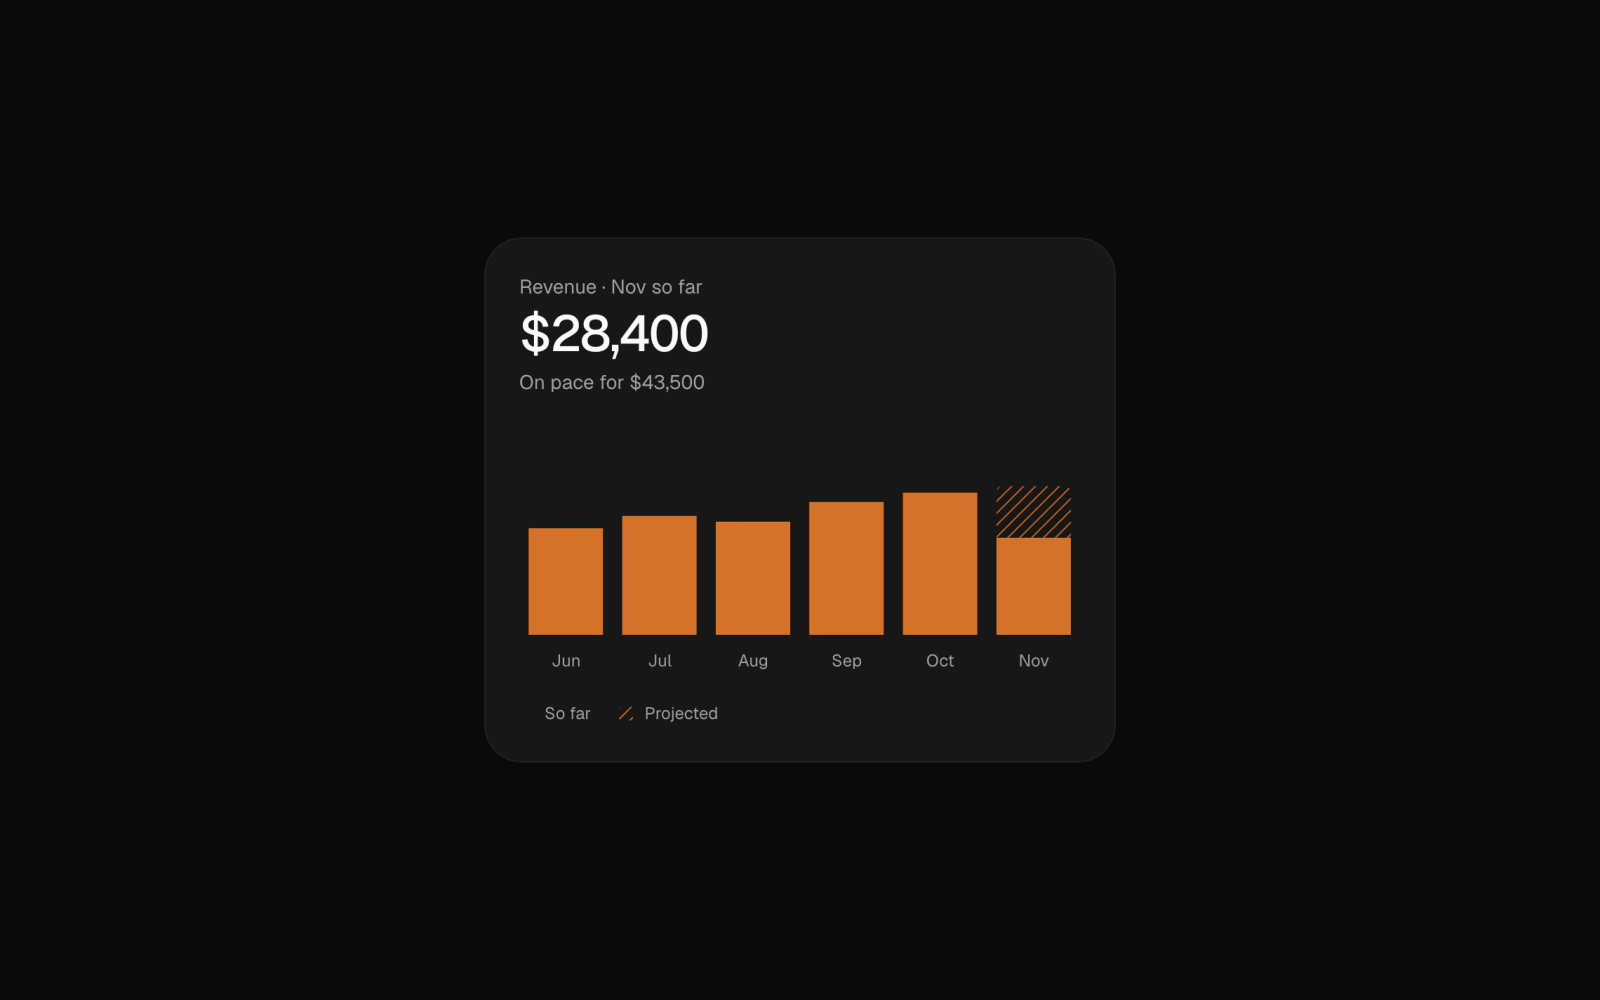
Monthly bar chart that marks the unfinished month: the amount so far is solid and the projection for the rest is hatched, with an on-pace total and a legend.
Horizontal Ranking Bar Chart
bar-chart-02
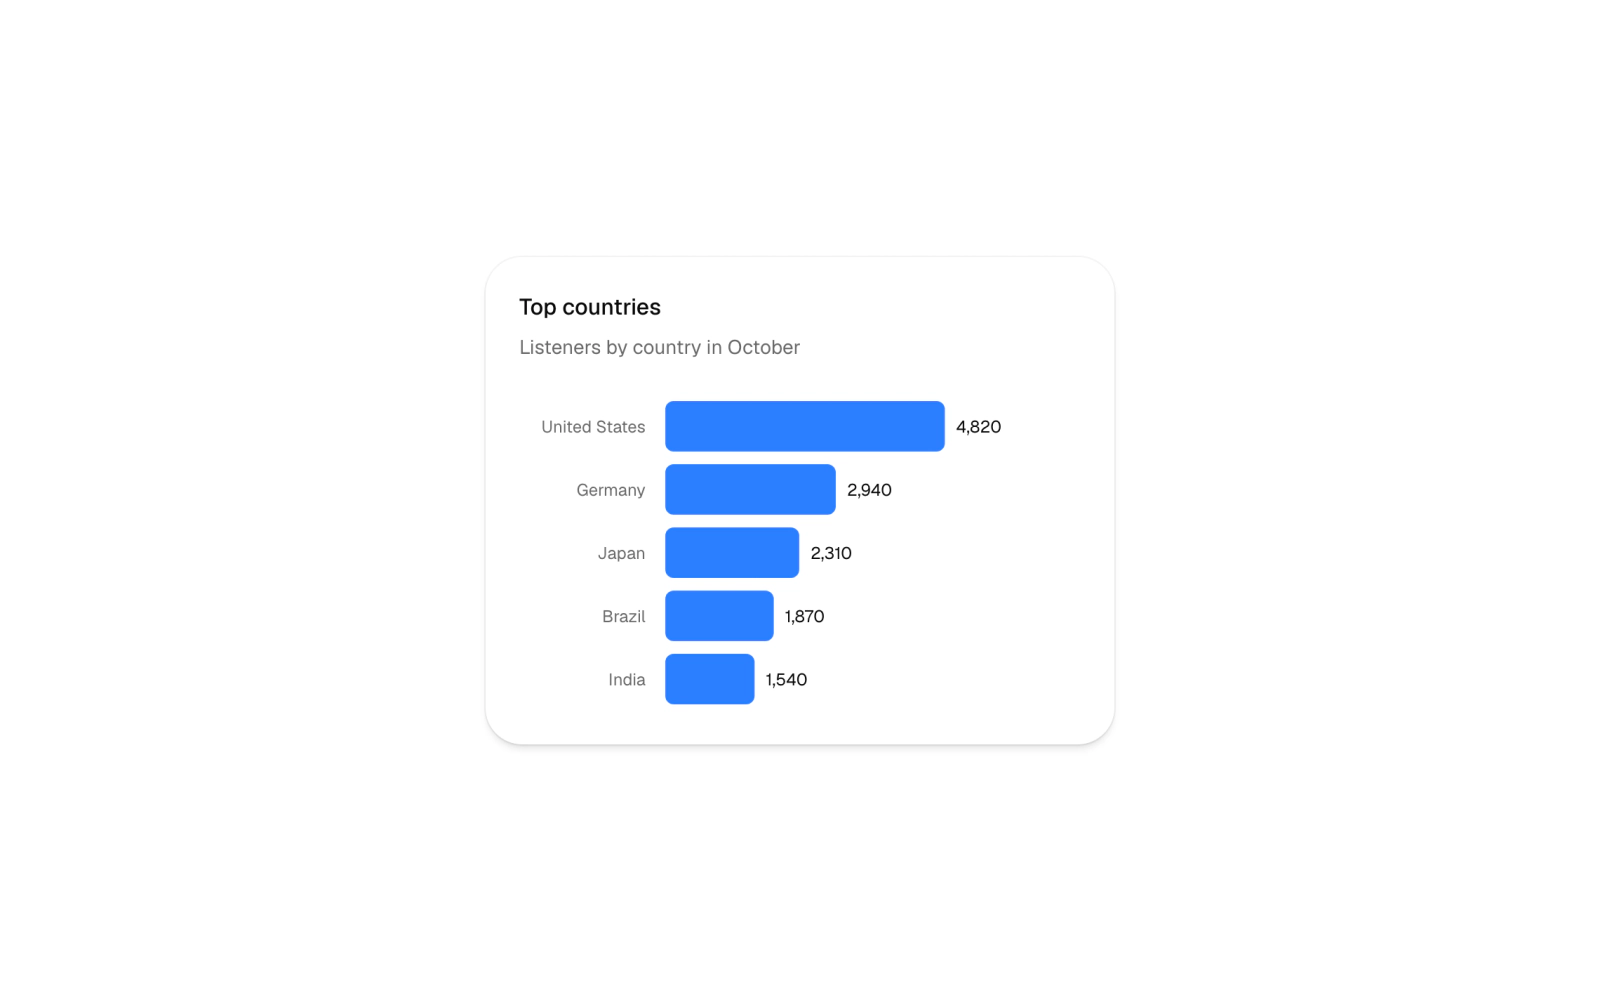
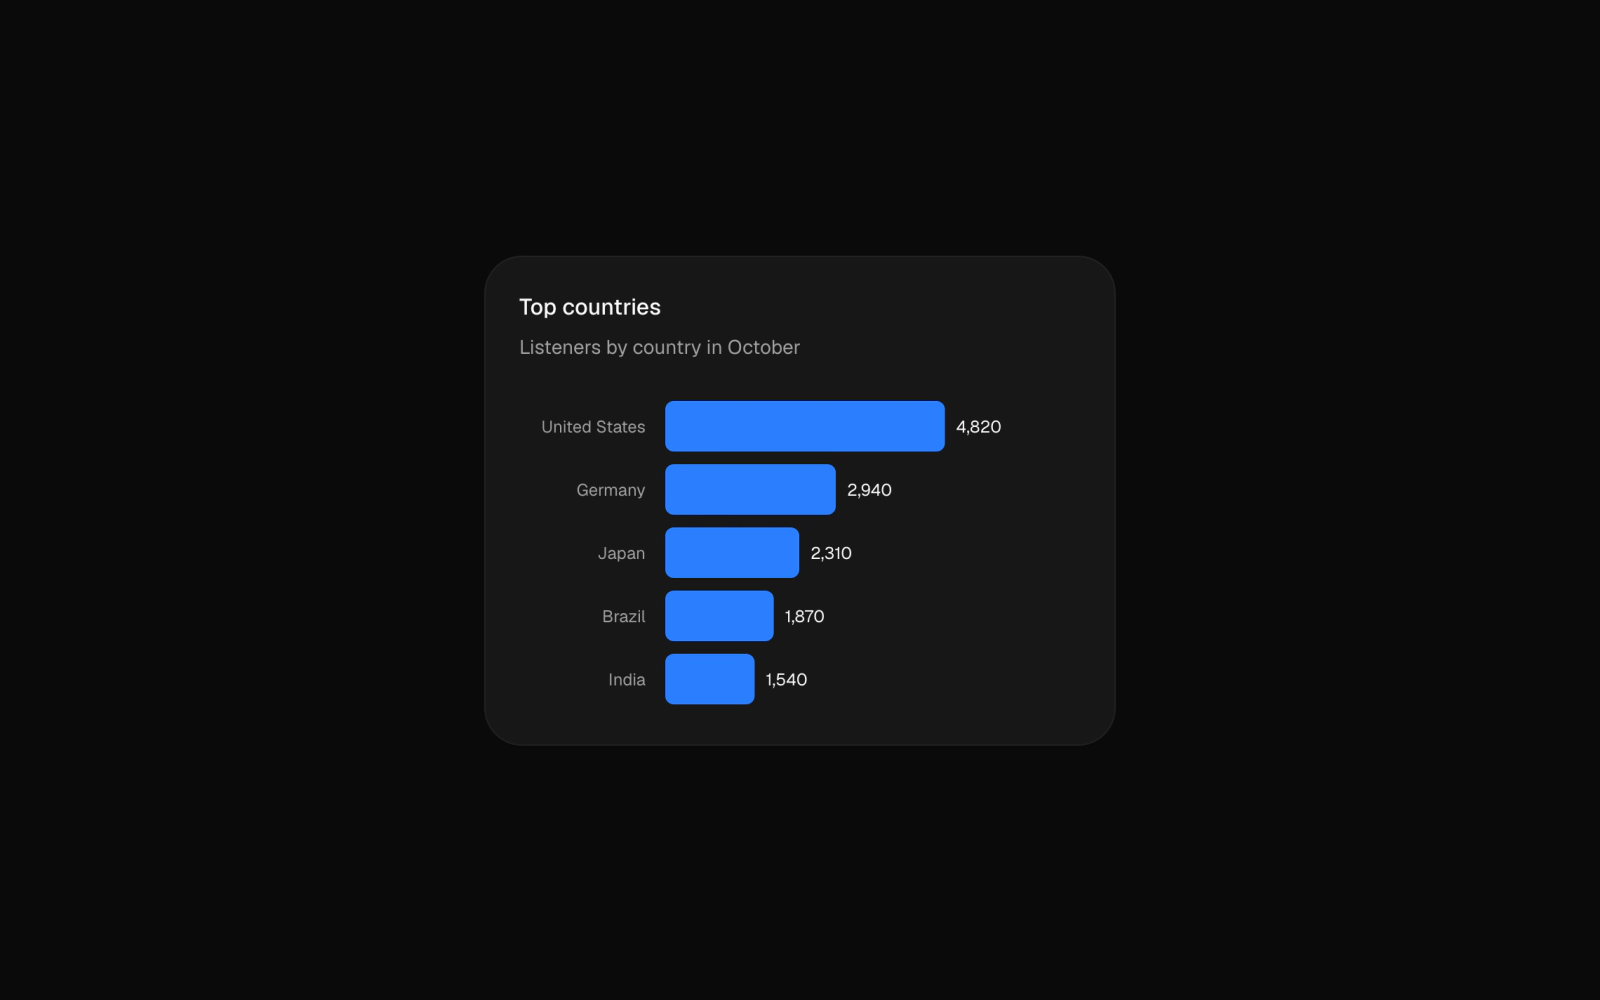
Horizontal bar chart card for a leaderboard: five countries ranked by listeners, with country names on the axis and values printed at the end of each bar.
Labeled Line Chart Card
line-chart-01
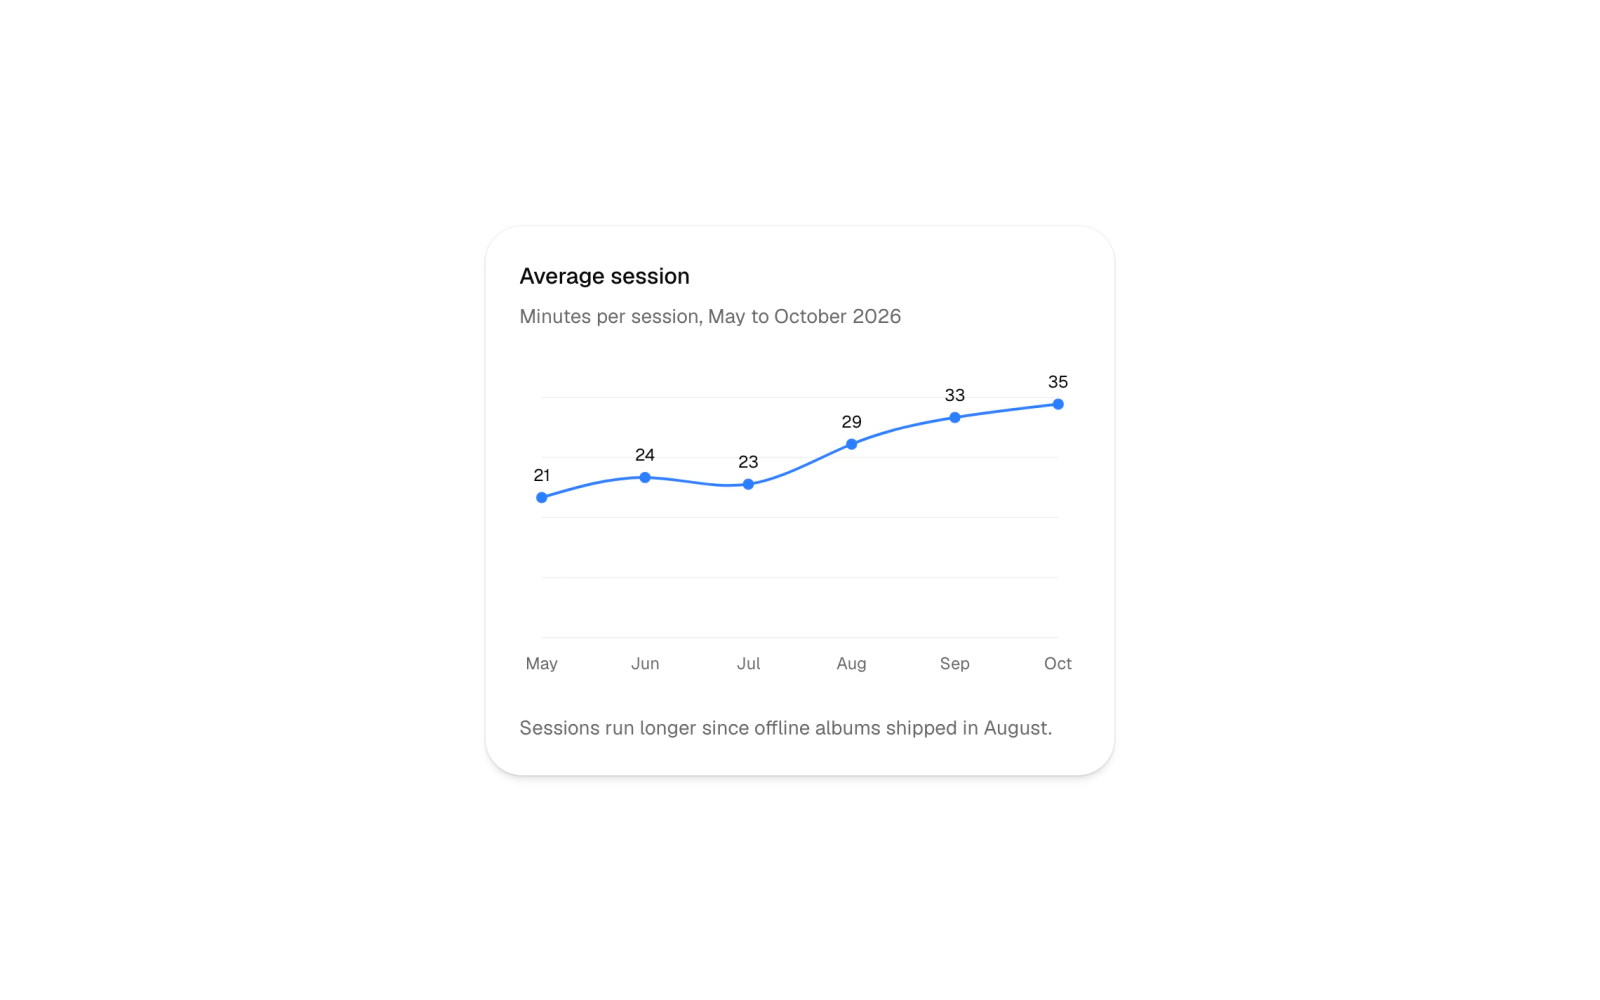
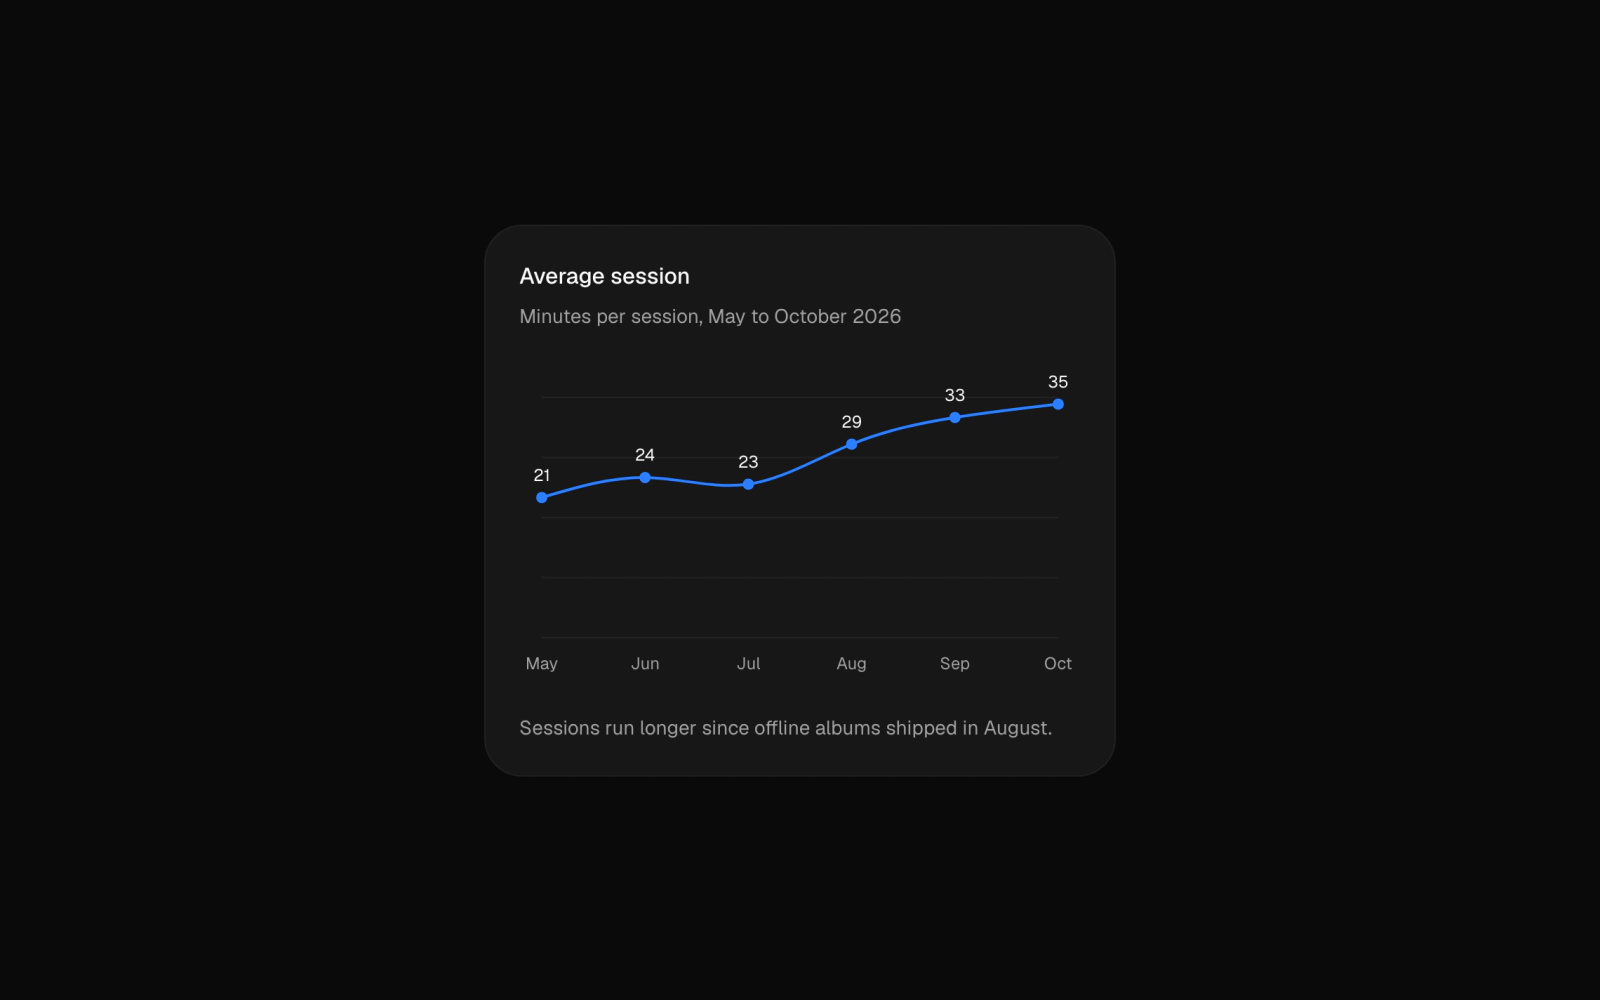
Line chart card for engagement analytics: a single-series time series of average session minutes by month, each point labeled with its value, and a footer note on the trend.
Listeners Area Chart Card
area-chart-01
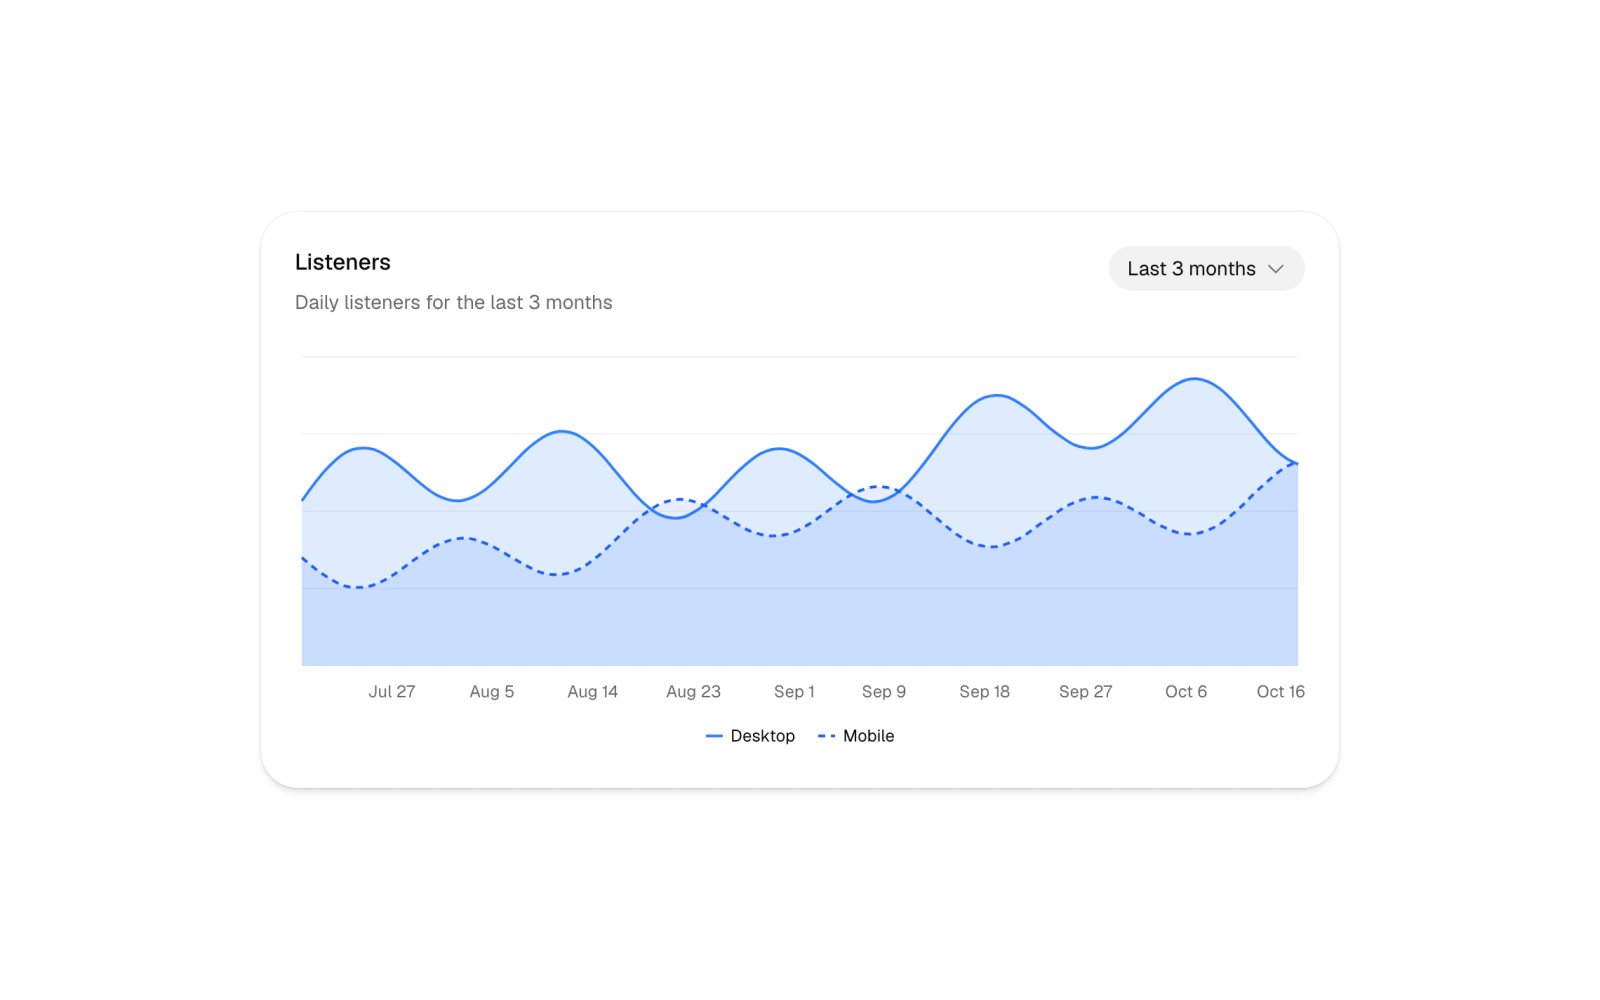
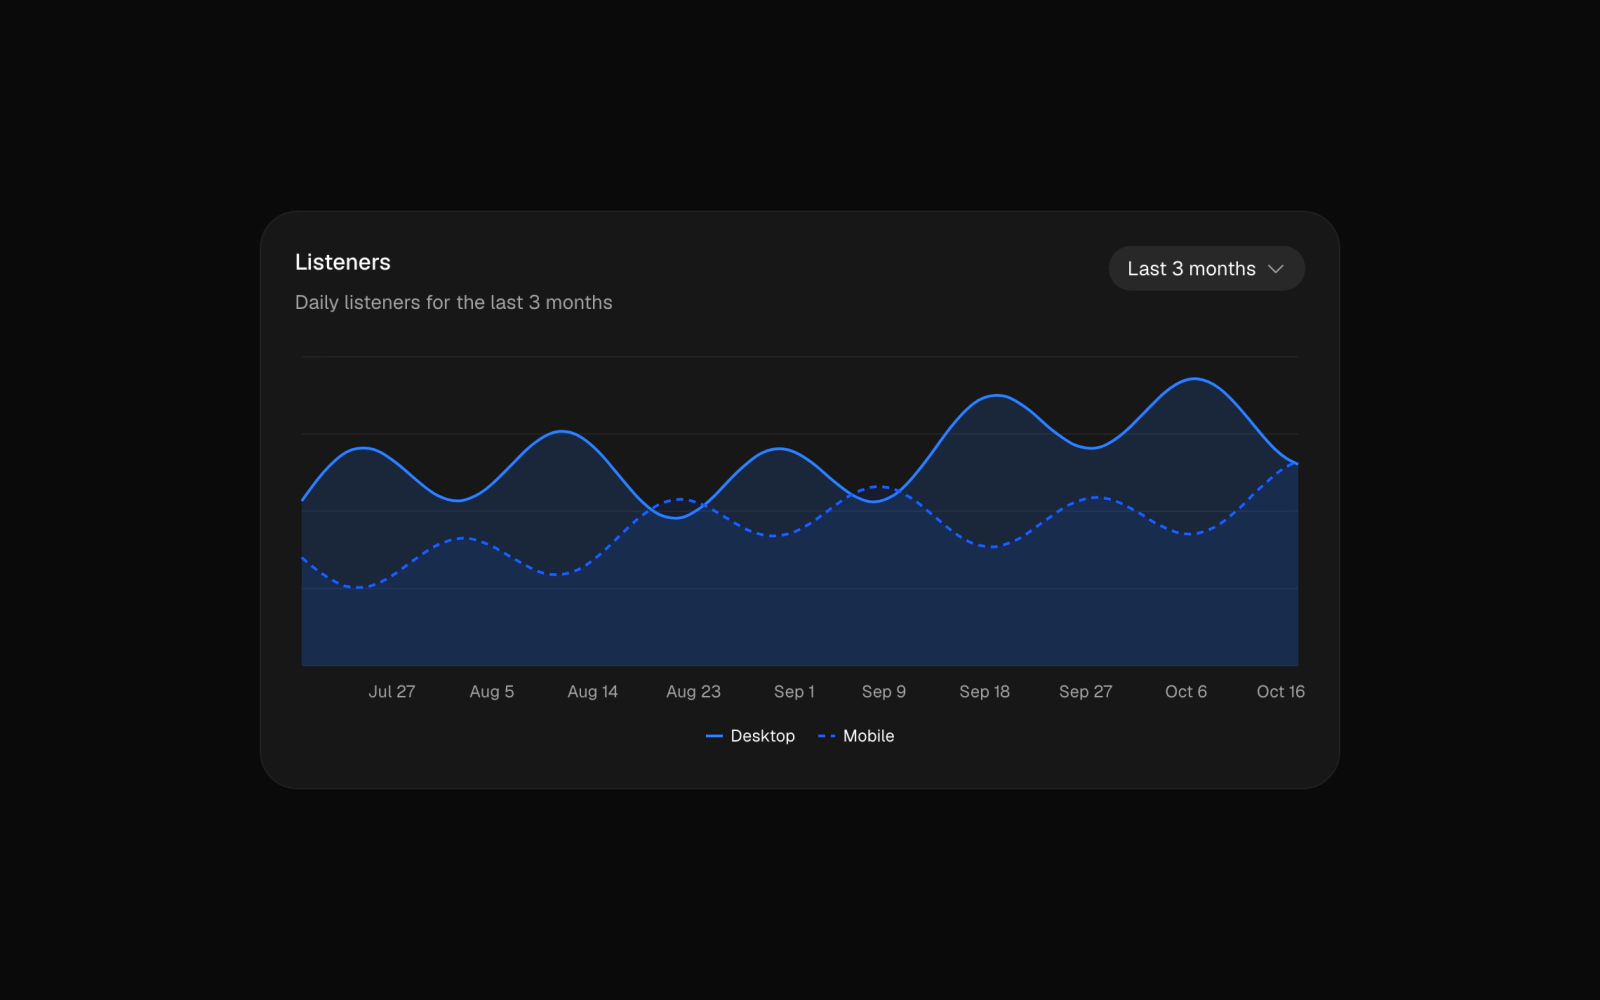
Area chart card for analytics dashboards: a two-series time series of daily listeners, desktop solid and mobile dashed, with a select for 90, 30 or 7 days and a legend that draws the dash.
Listening Moods Radar Chart
radar-chart-01
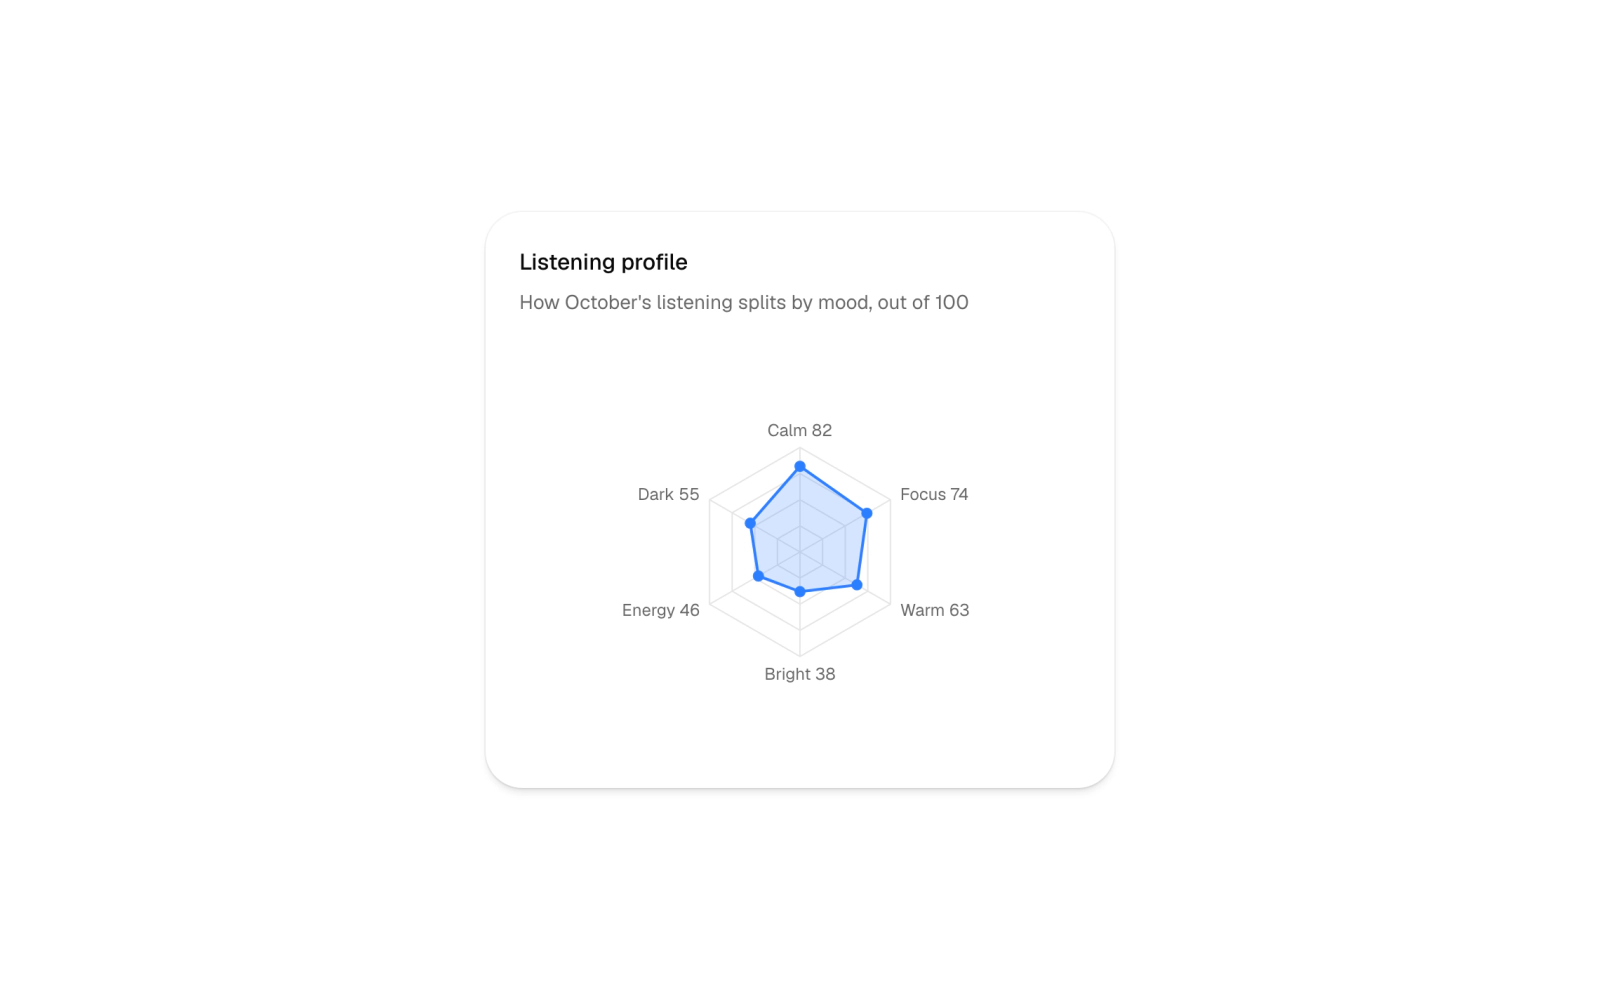
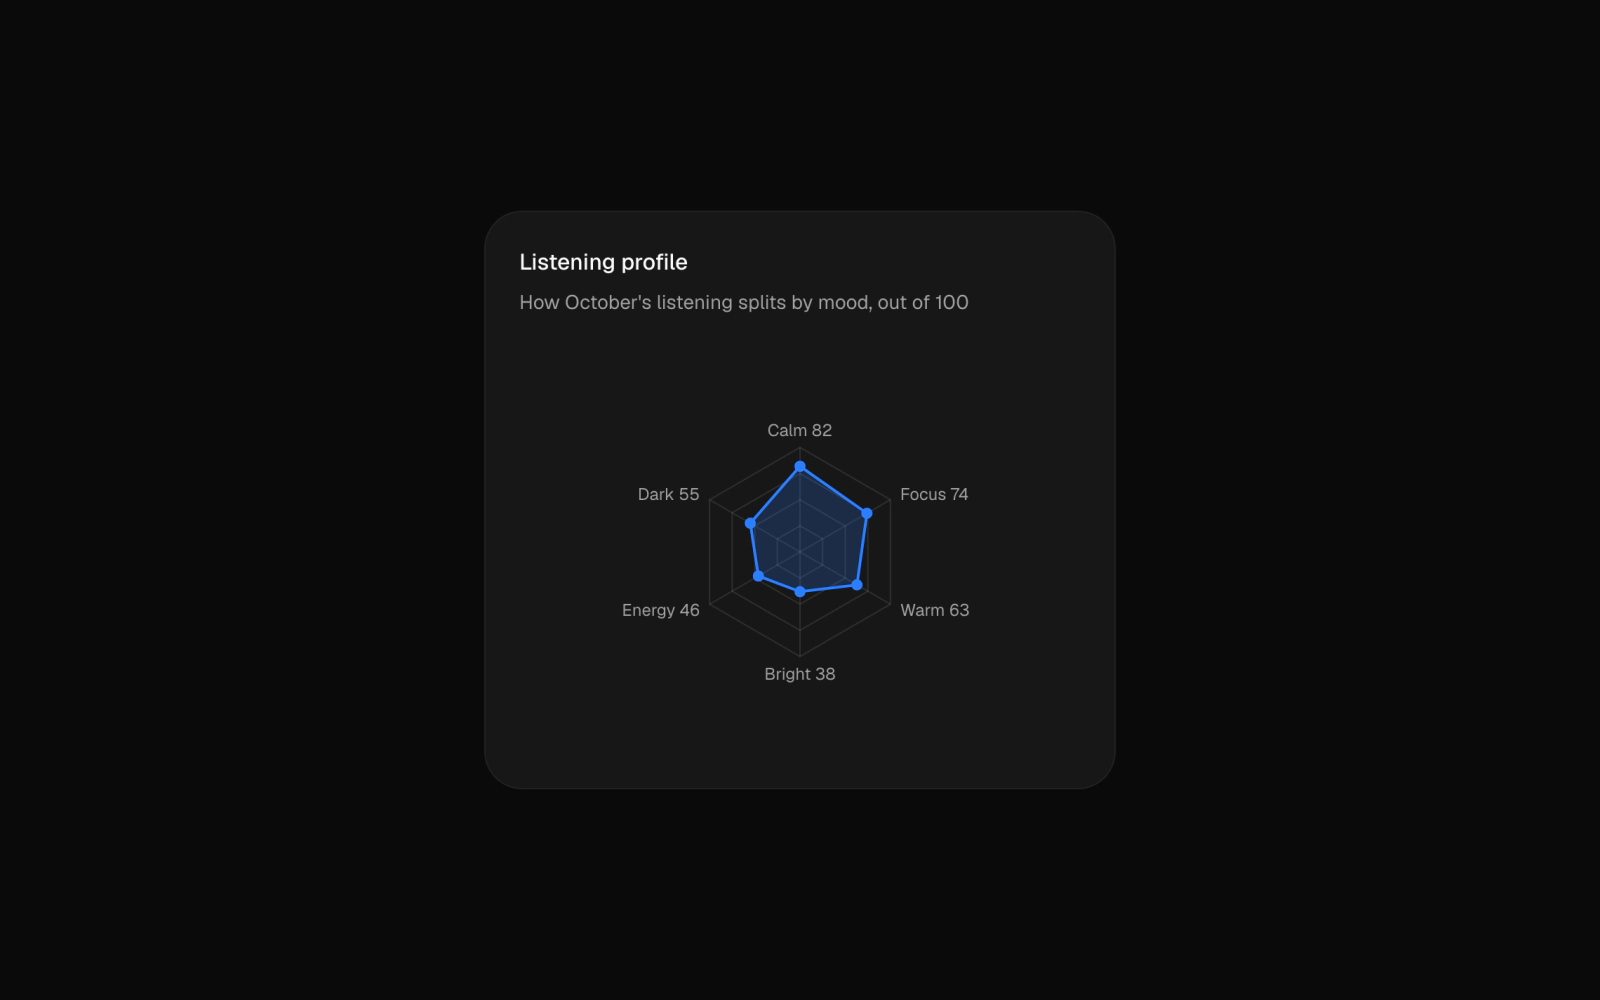
Radar spider chart card for scores and profiles: six listening moods rated out of 100, each axis label carrying its score so the values read without the shape.
Monthly Column Bar Chart
bar-chart-01
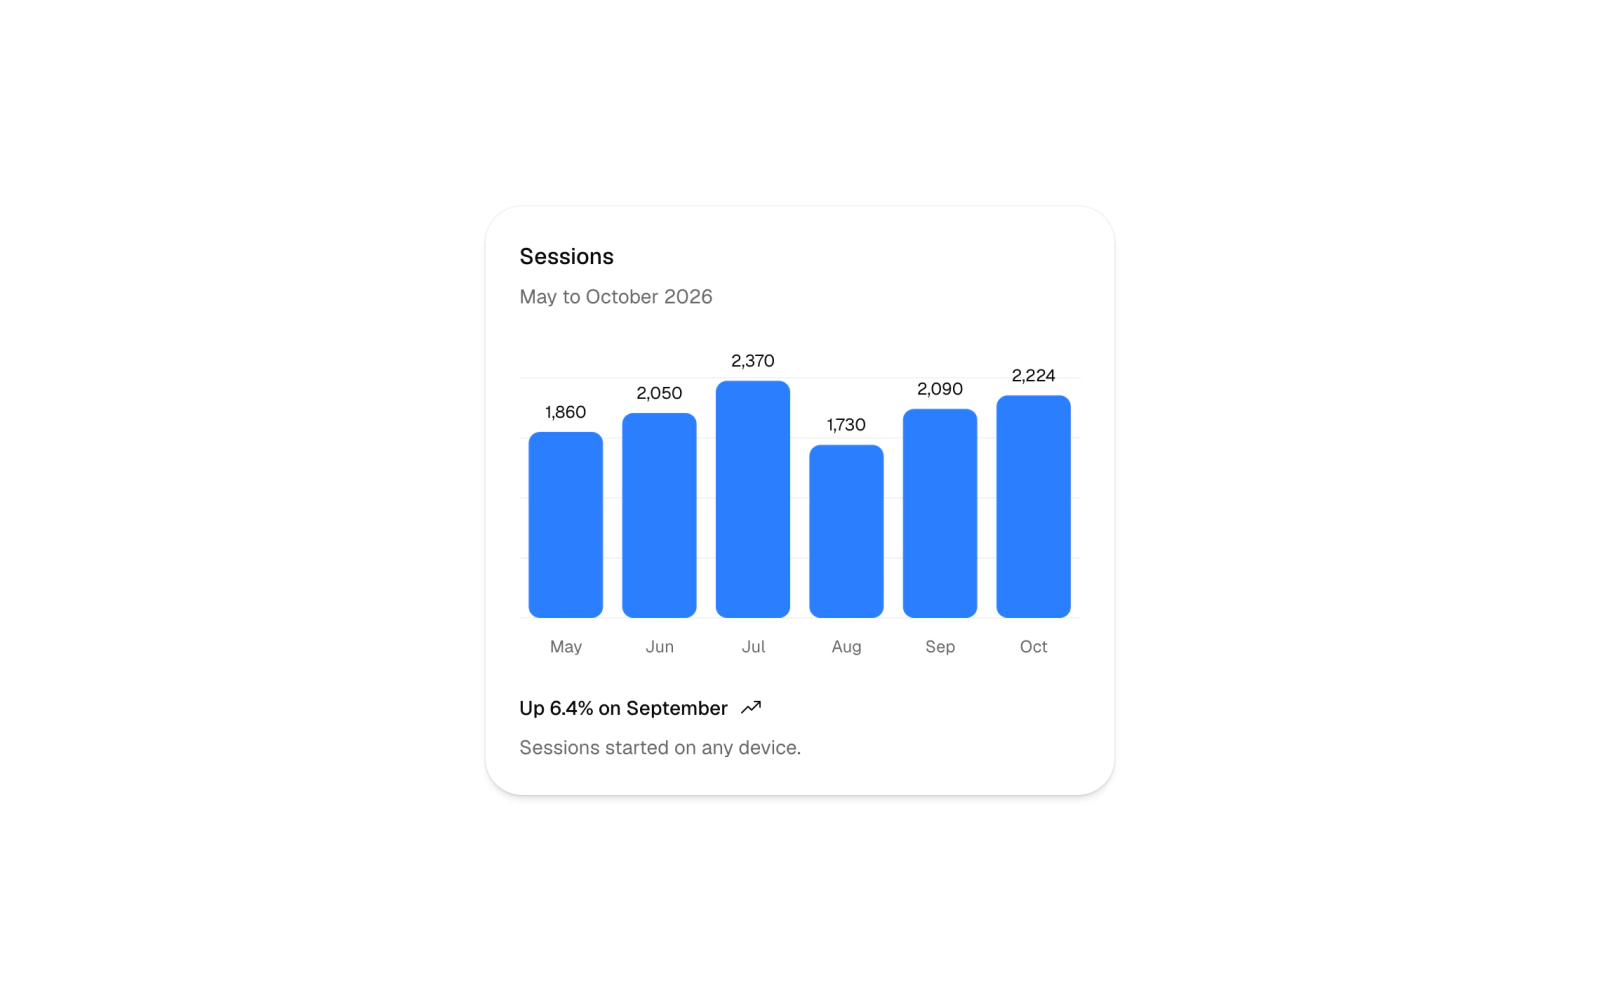
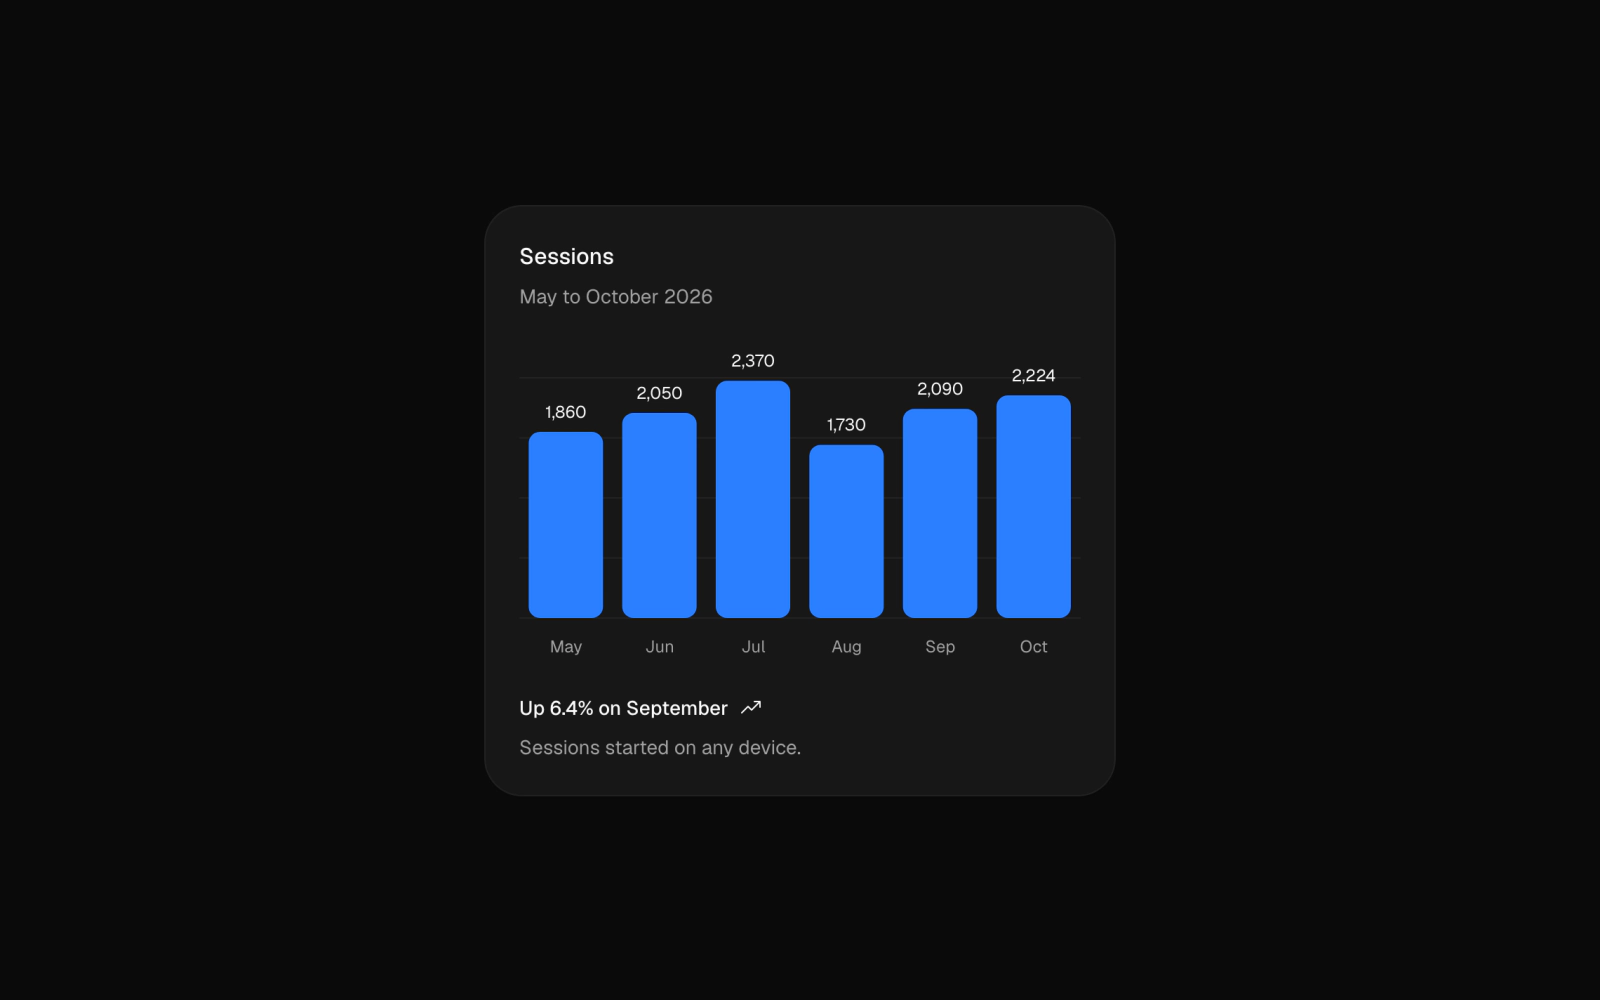
Vertical bar chart card for monthly stats: a column chart of sessions with the value printed above each rounded bar, and a footer with a trend sentence, icon and note.
Painted Bars
bar-chart-12
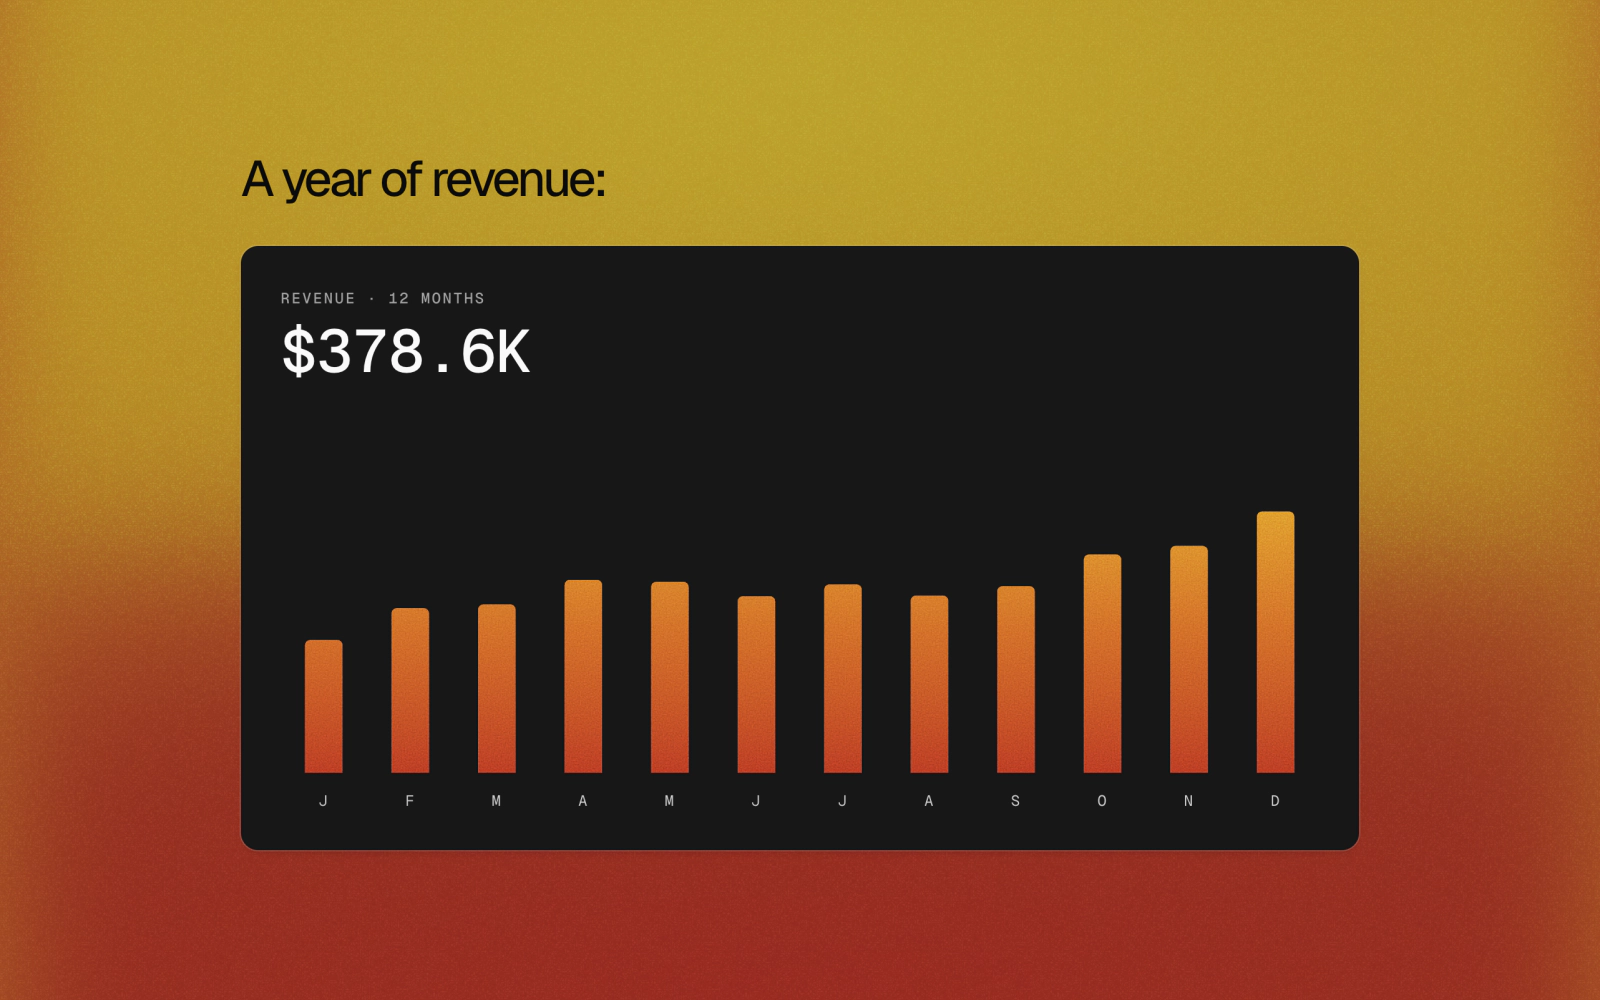
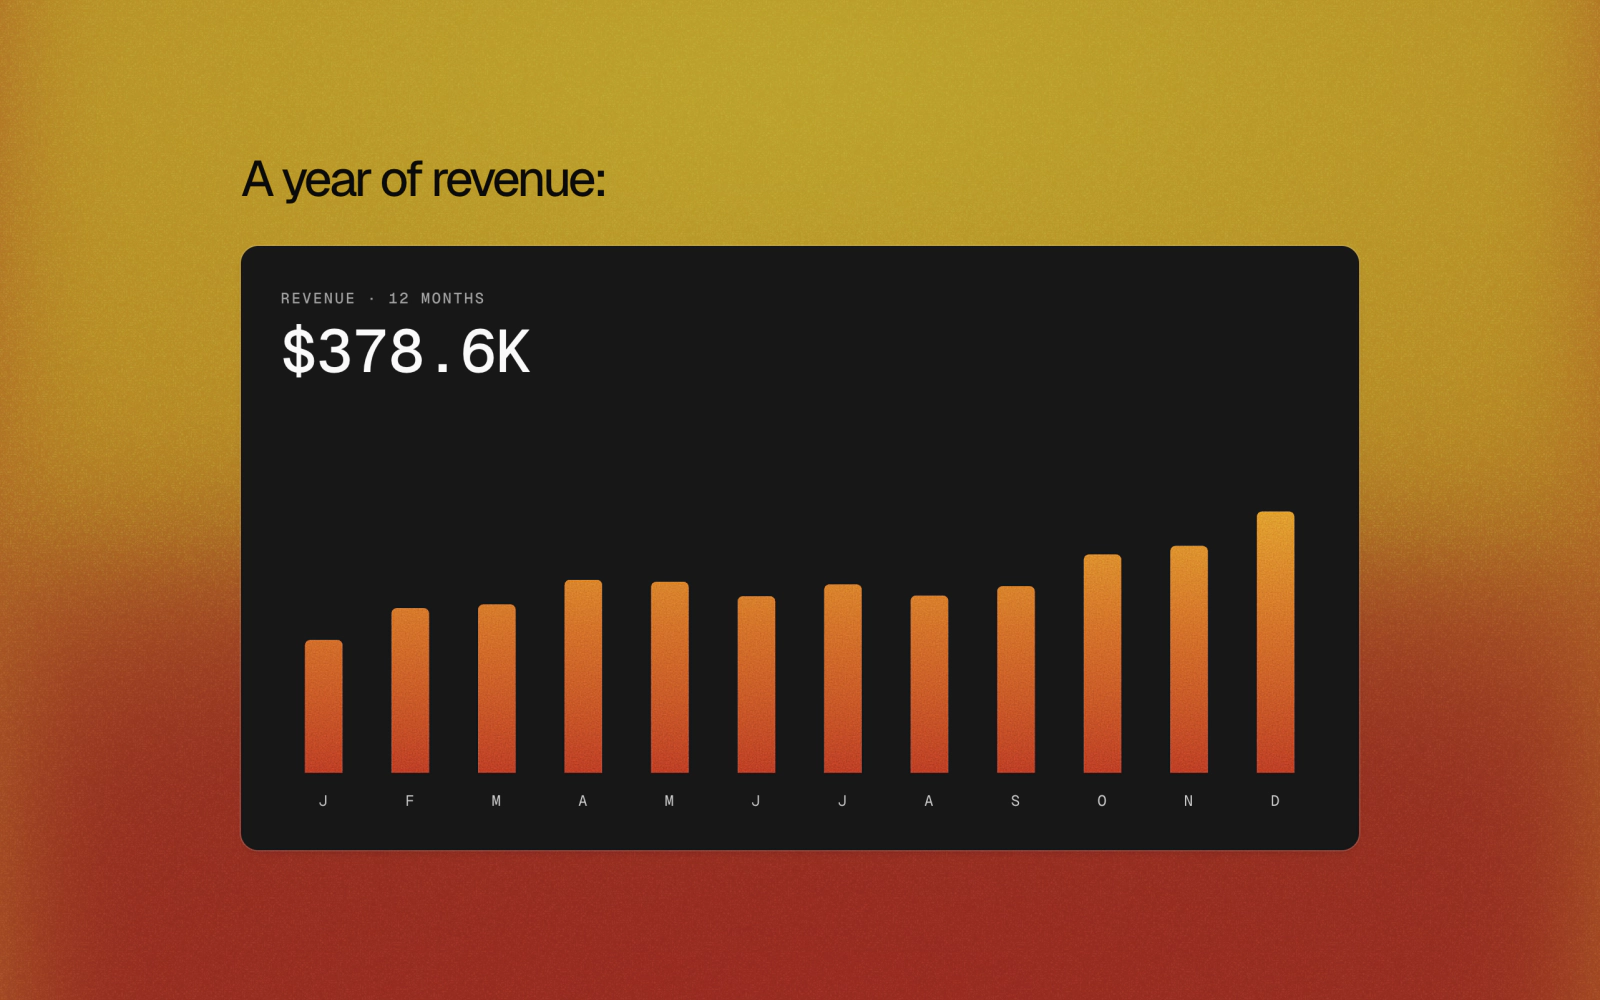
A year of revenue on a dark card over a warm wash, every bar painted from one gold-to-terracotta field with paper grain, so the bars read as one painting cut into strips.
Painted Line
area-chart-07
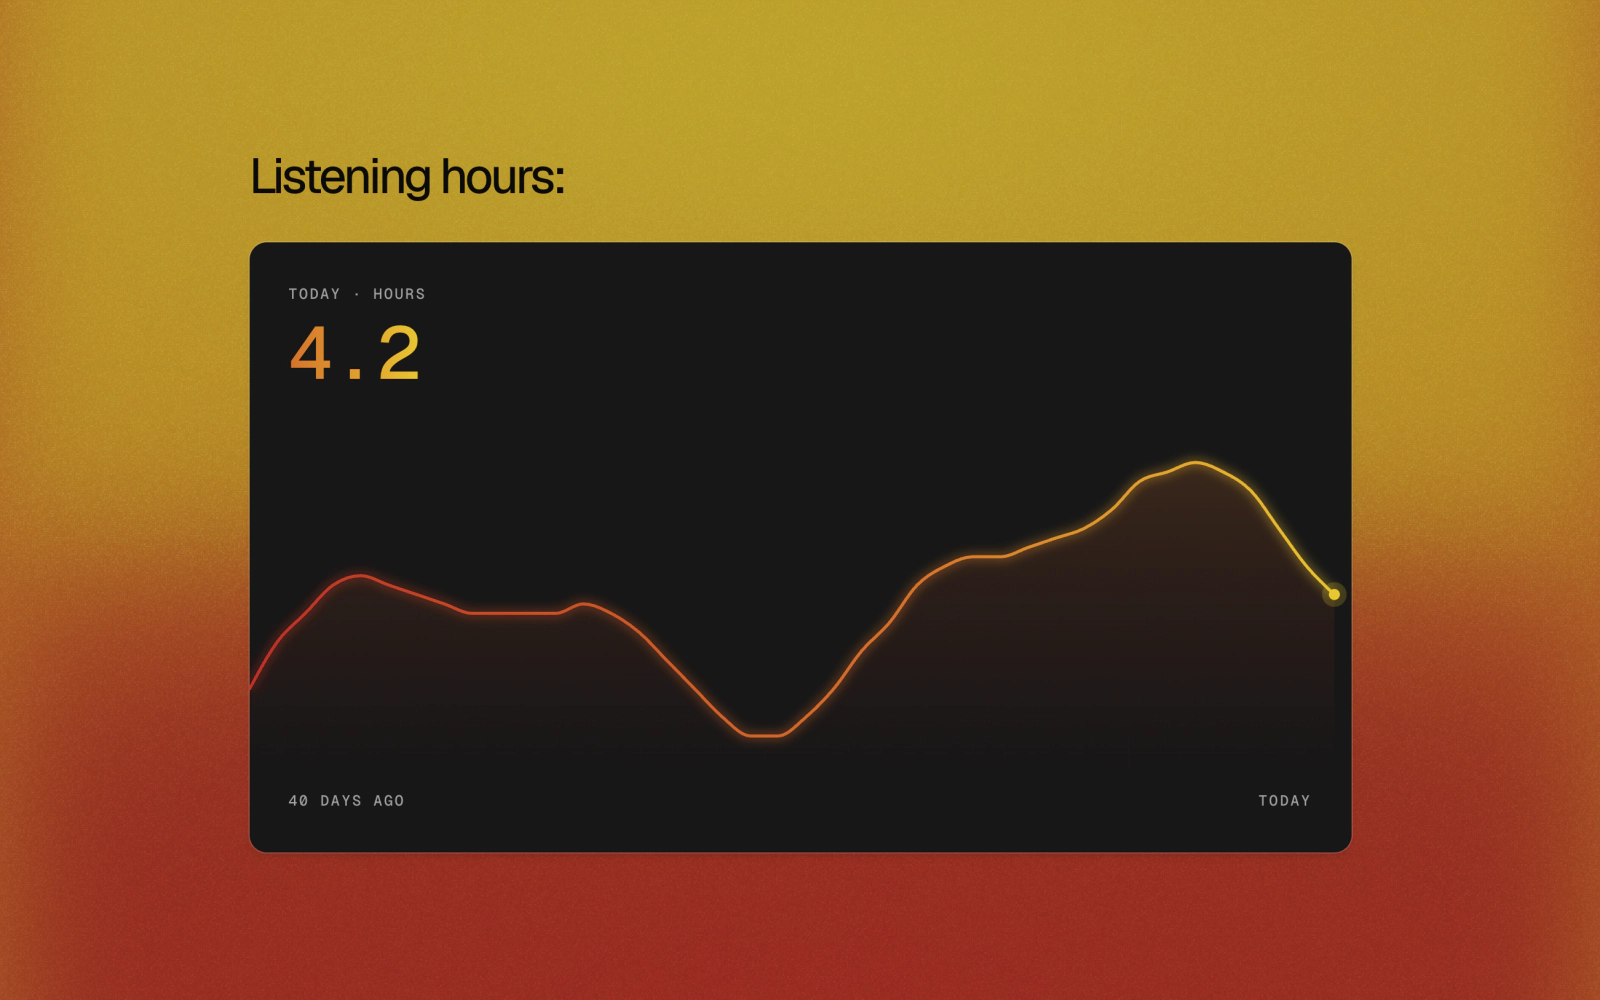
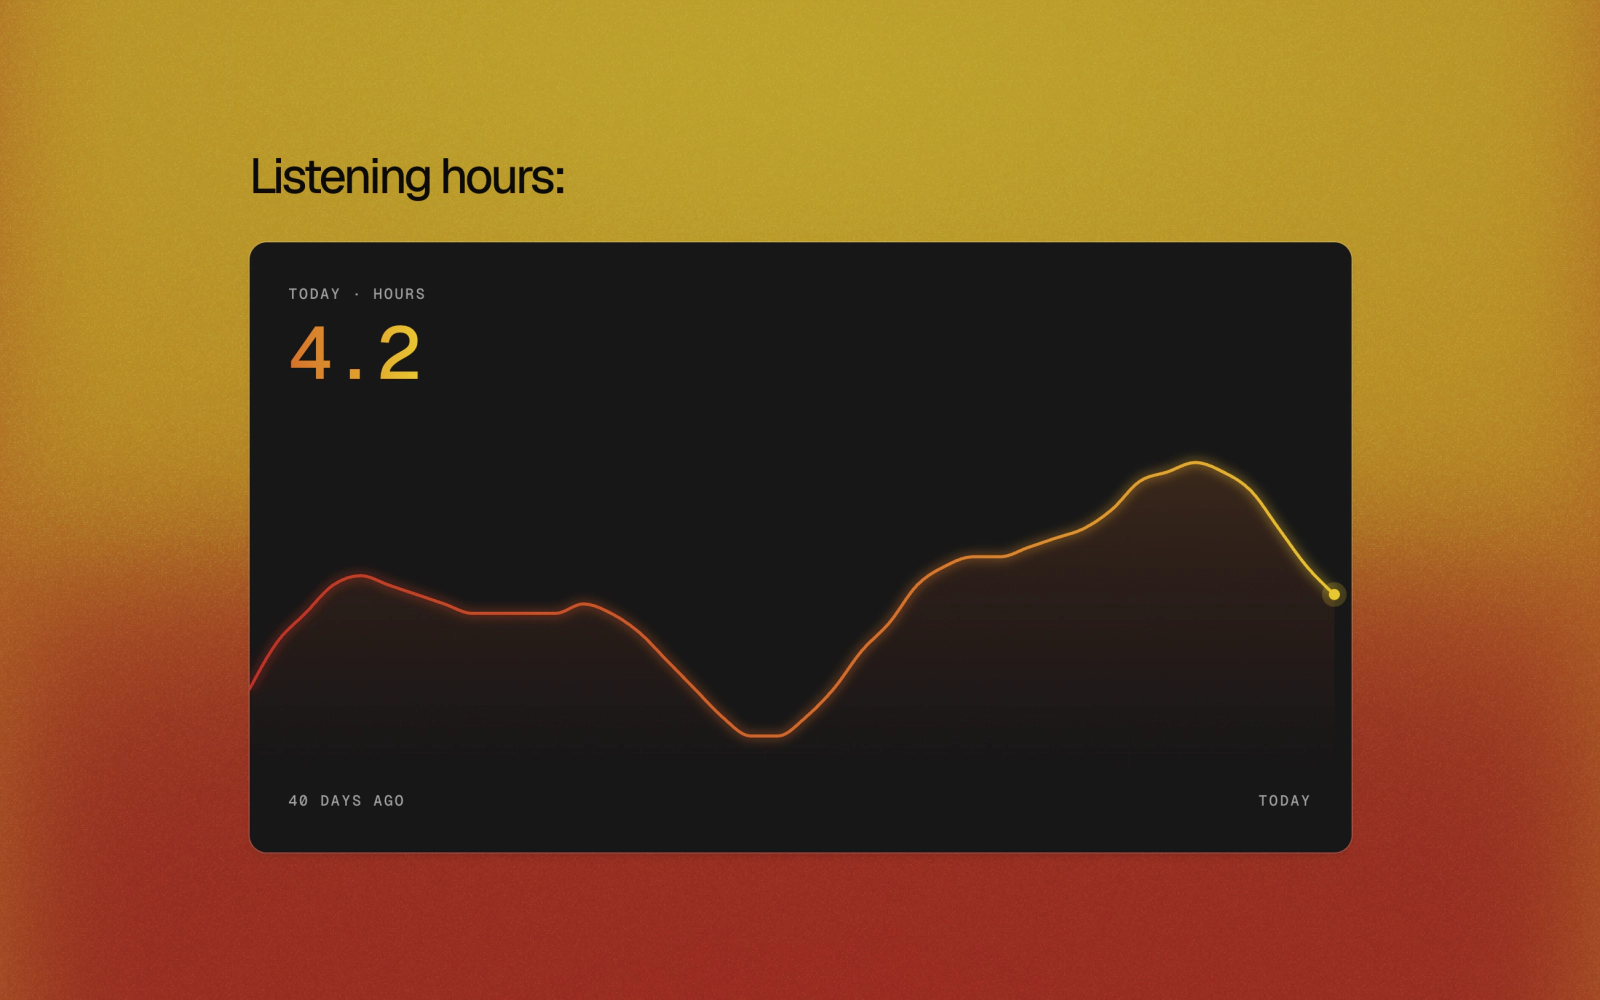
Daily listening hours on a dark card over a warm wash: one line painted terracotta to gold along time with a soft glow, a halo on today and a gradient headline figure.
Pill Bars on Tracks
bar-chart-07
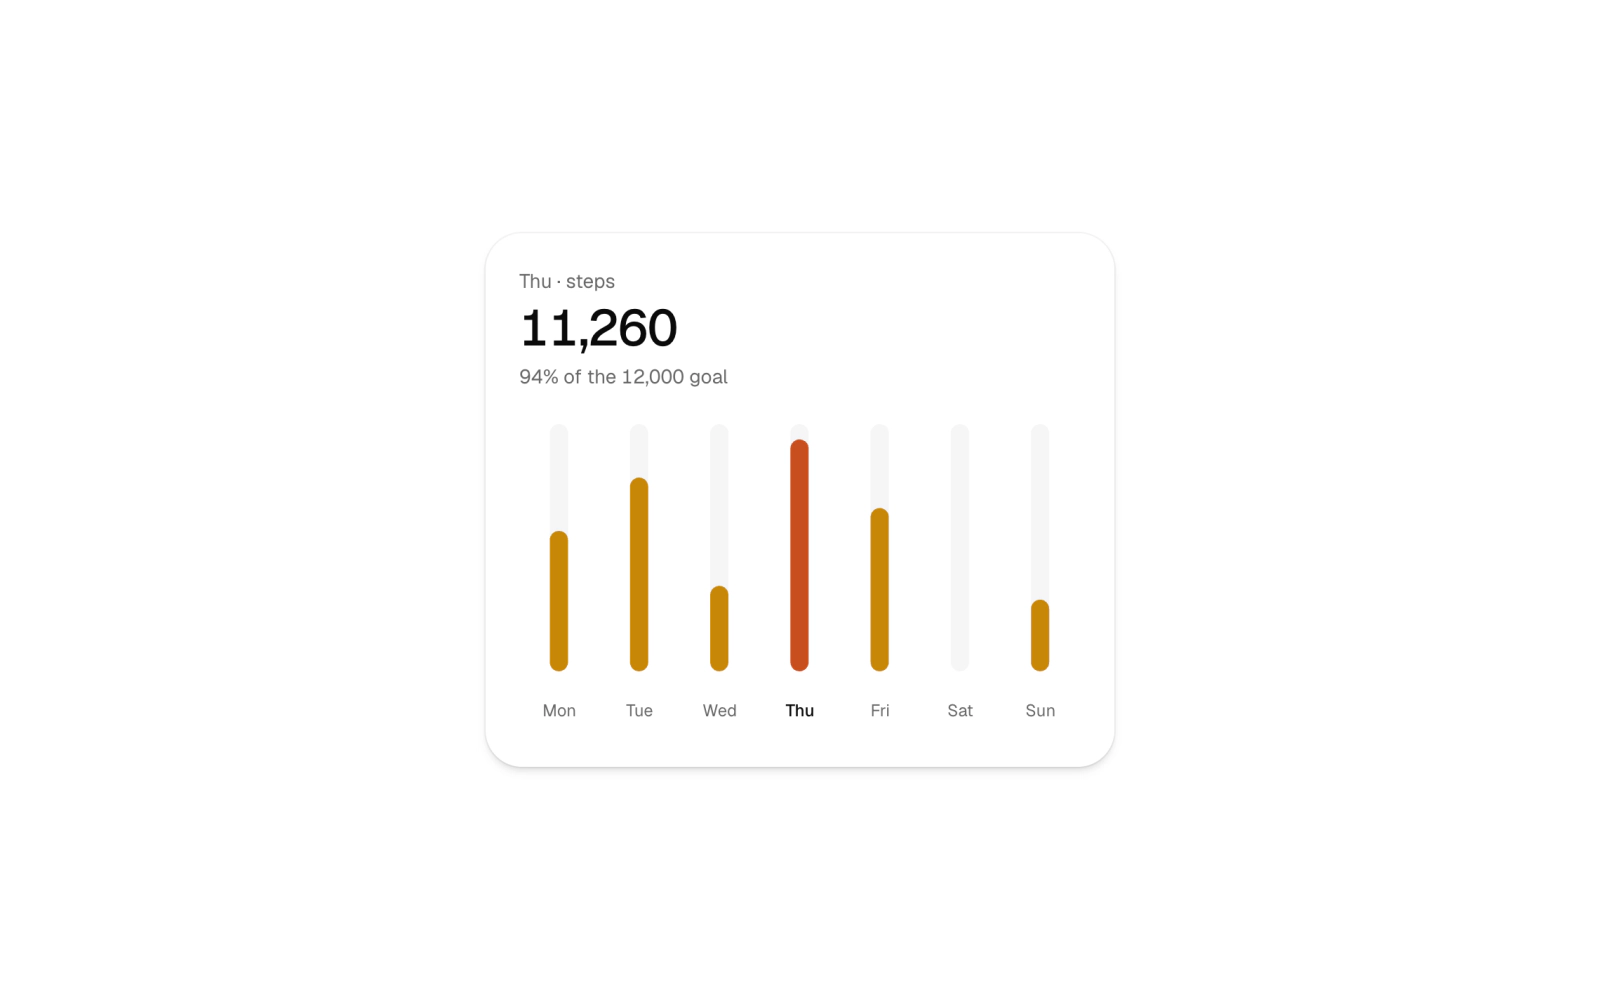
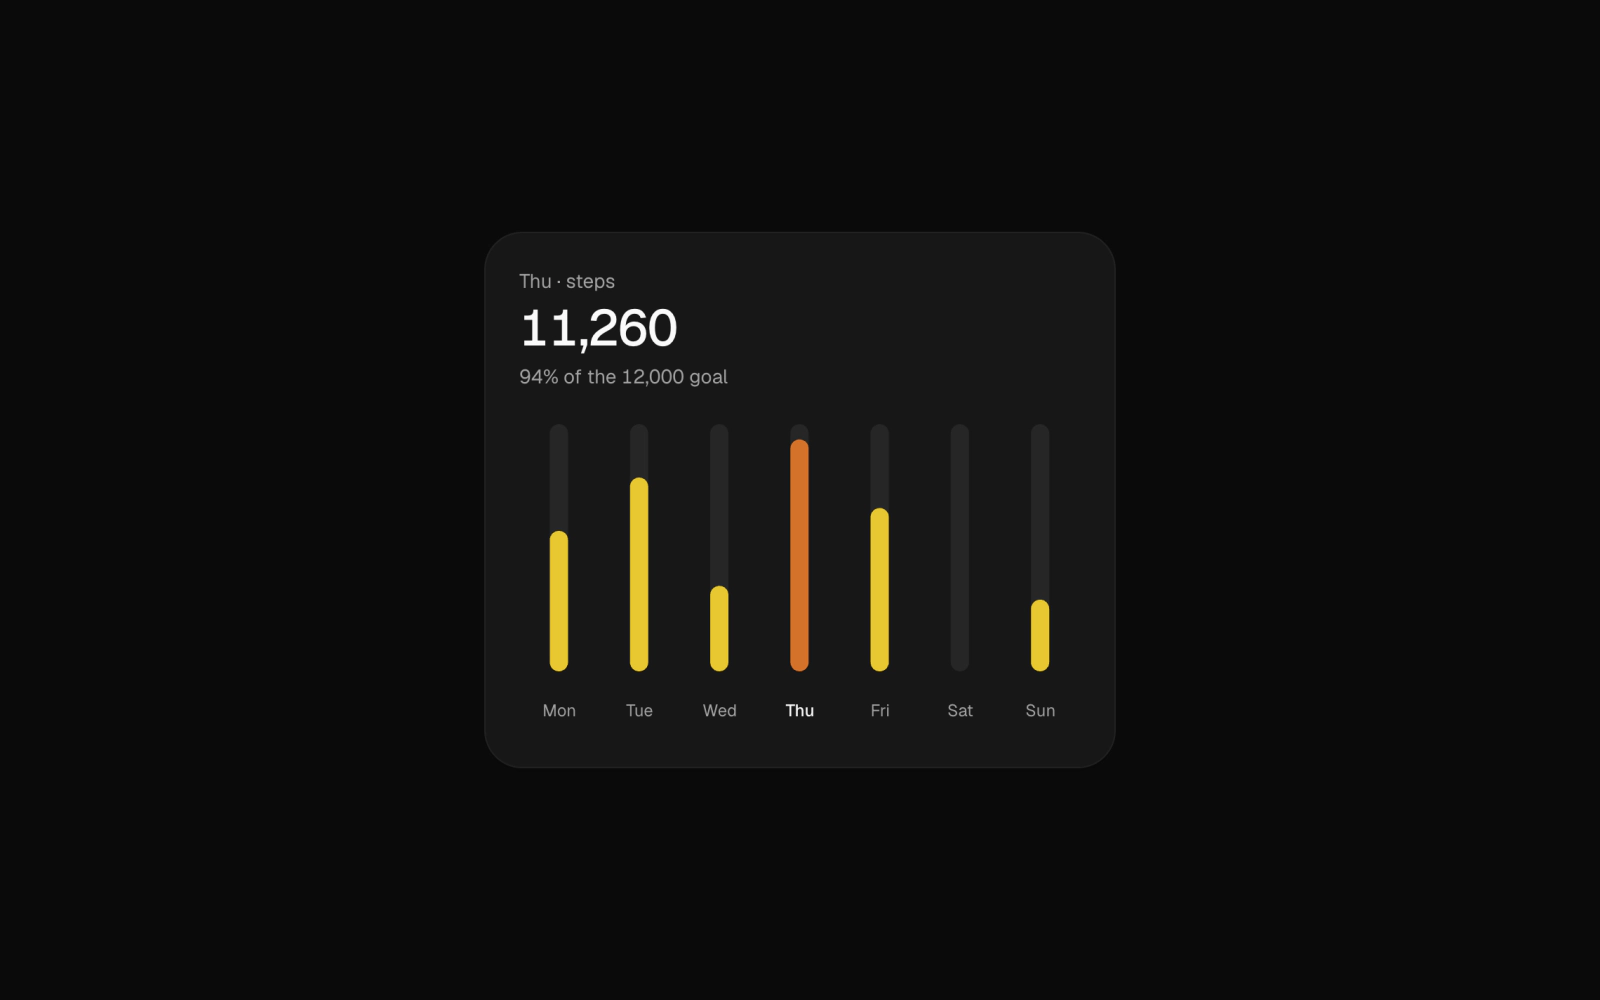
Weekly bar chart with rounded pill bars on full-height tracks: one day in focus drives the header value and goal percentage, chosen from day buttons or by clicking a bar.
Scrub Rule Area
area-chart-05
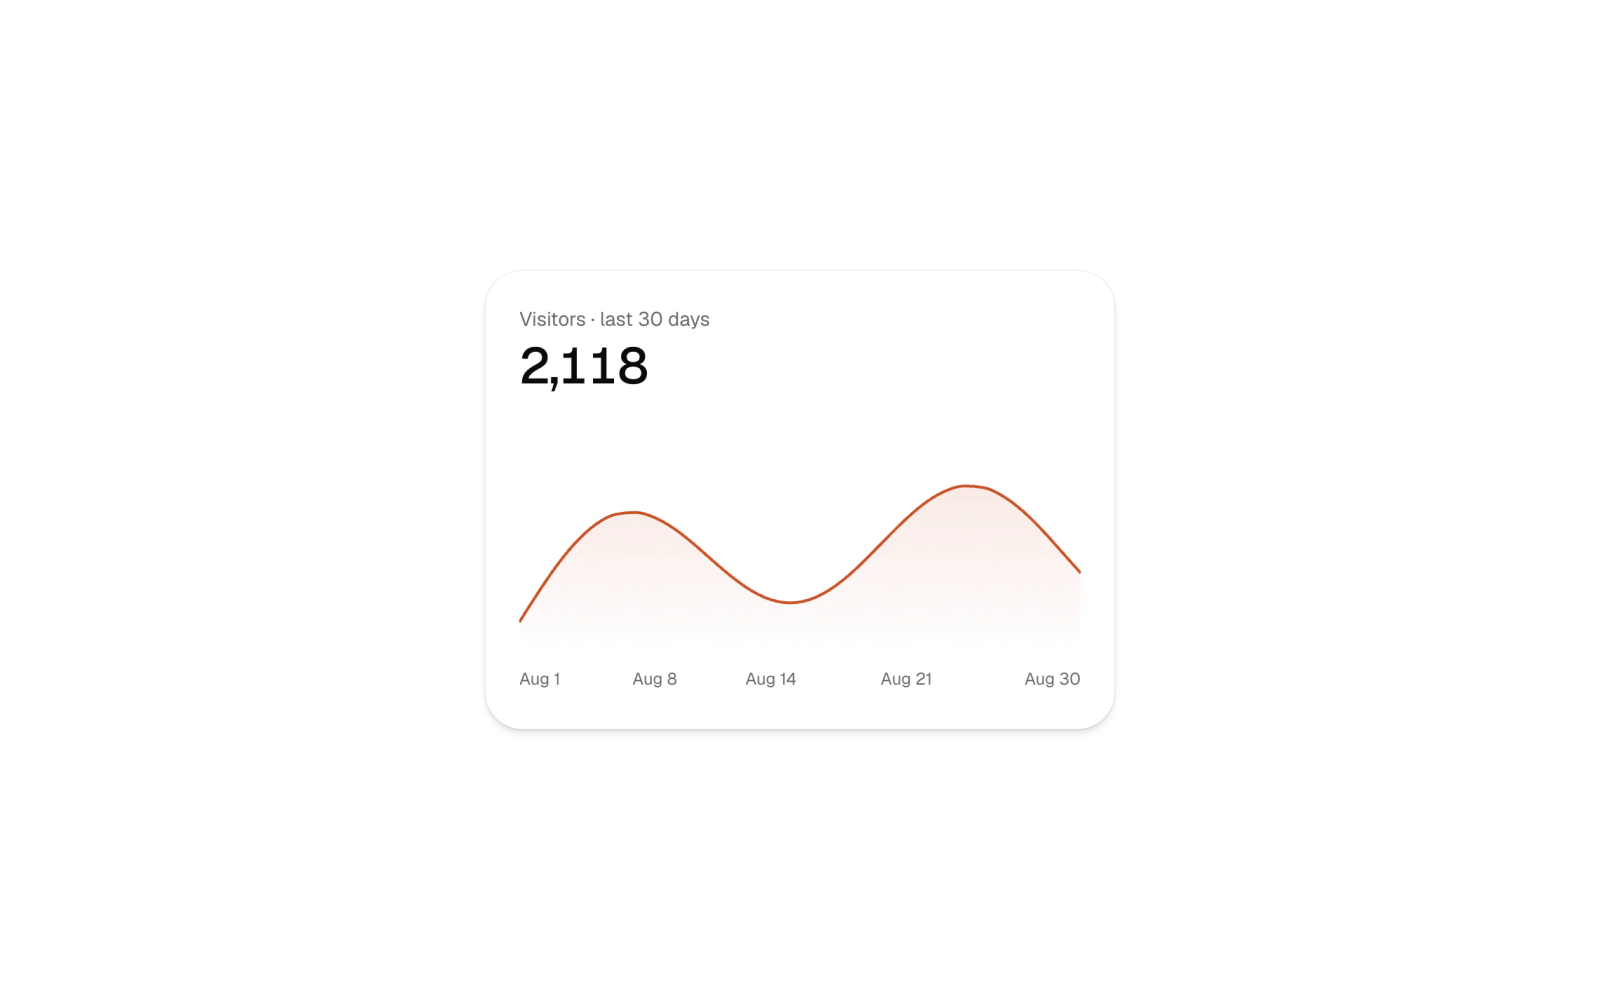
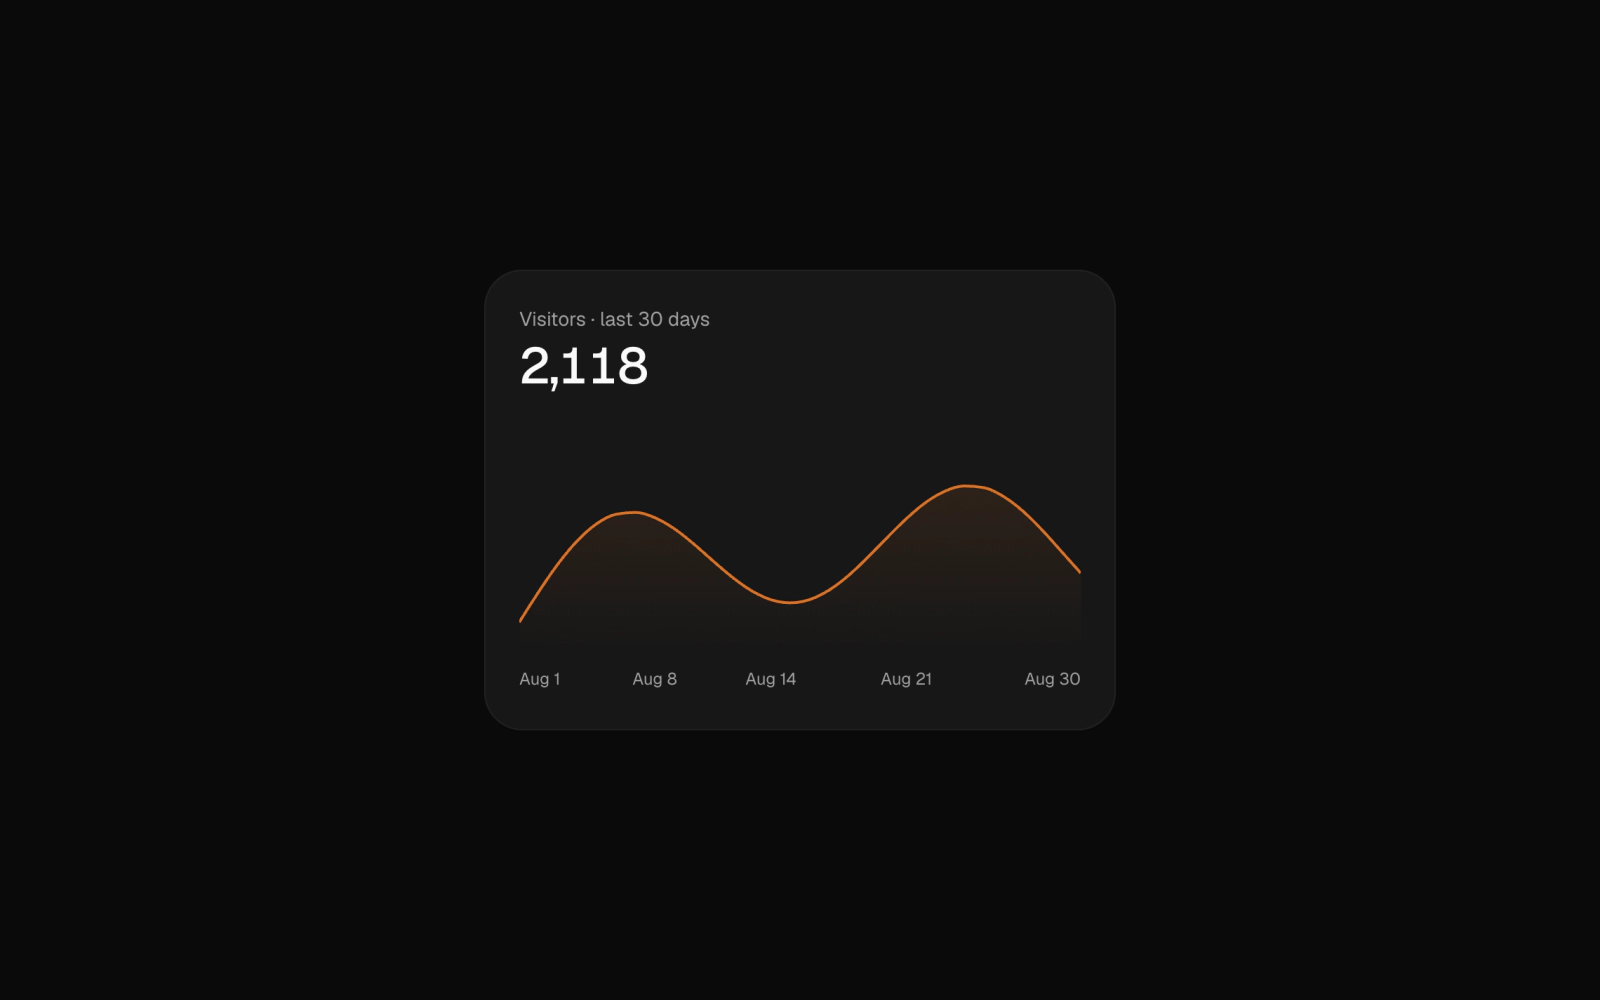
Area chart with a scrub rule: a full-height line follows the pointer or arrow keys, the active point carries a halo and the date and value stay pinned in a pill above the plot.
Sparkline Table
line-chart-04
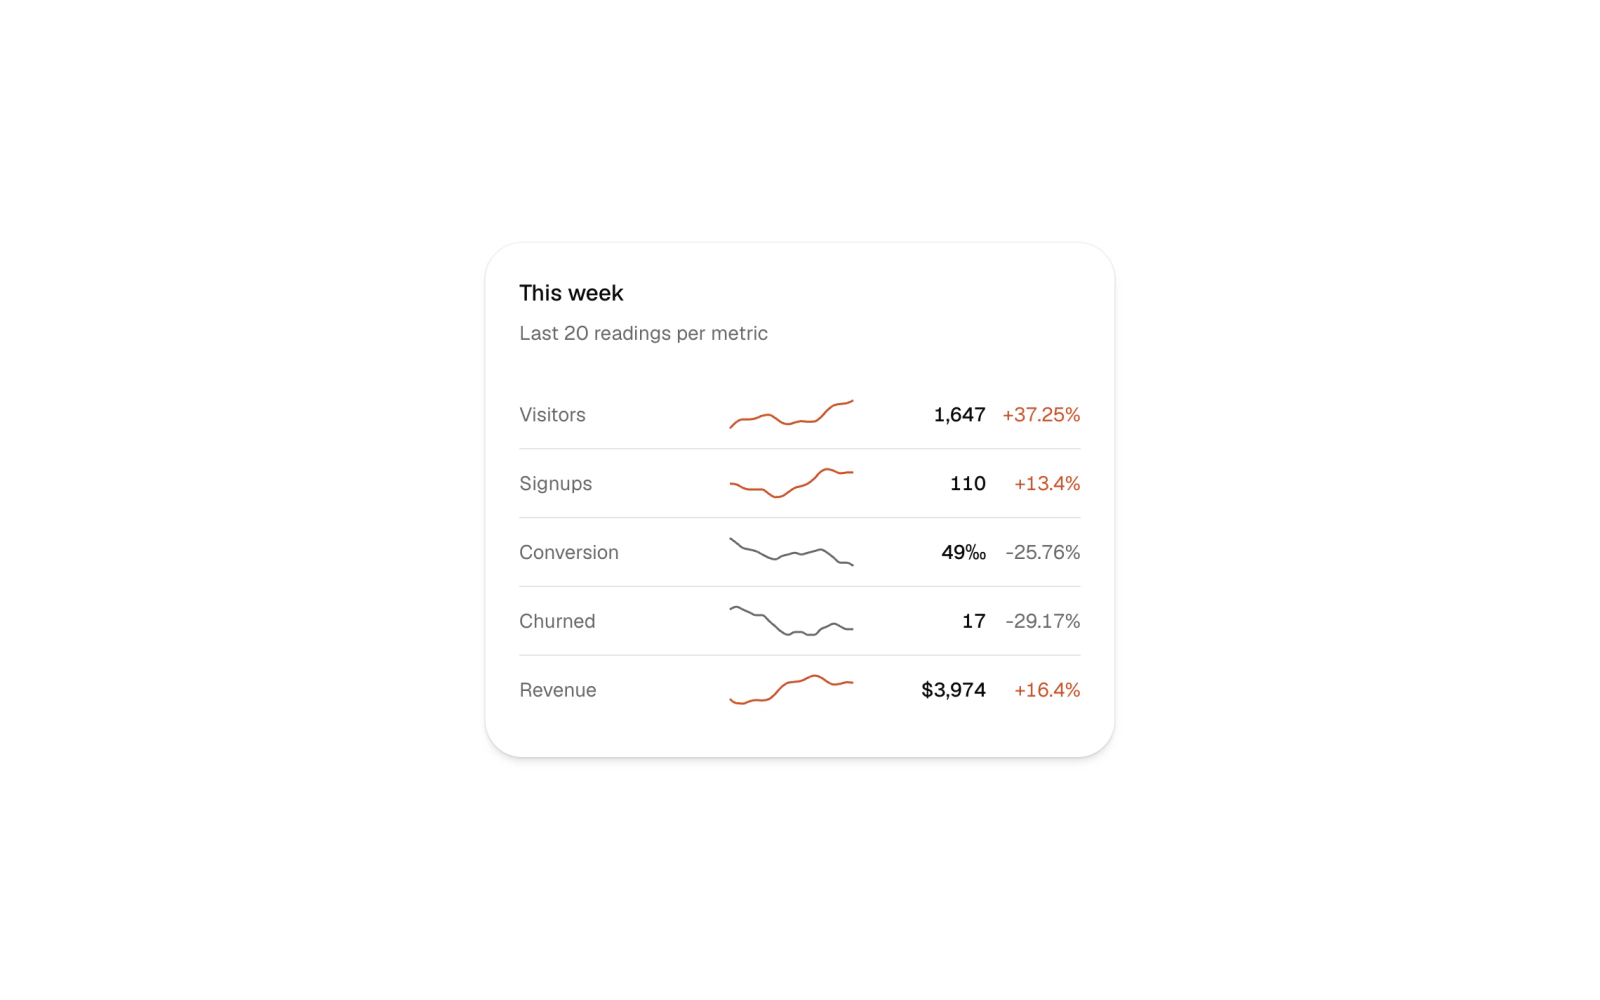
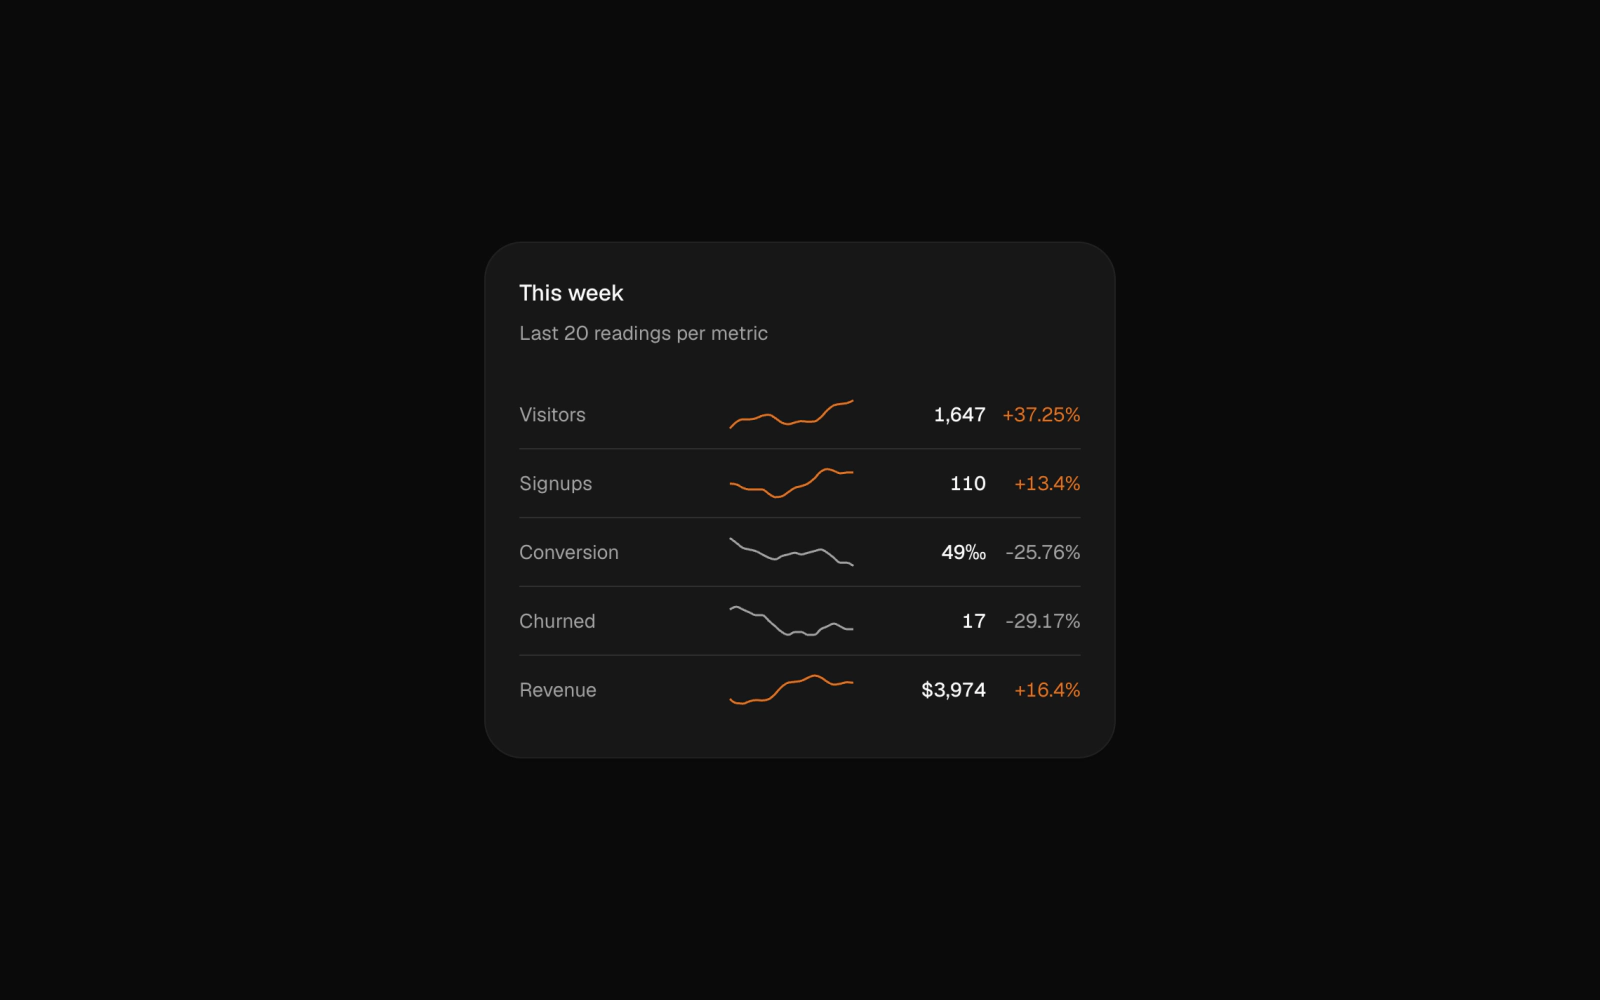
Metrics table with a small trend line in every row beside the latest value and its change; rising metrics draw in the chart color and falling ones in muted gray.
Split at Zero
area-chart-04
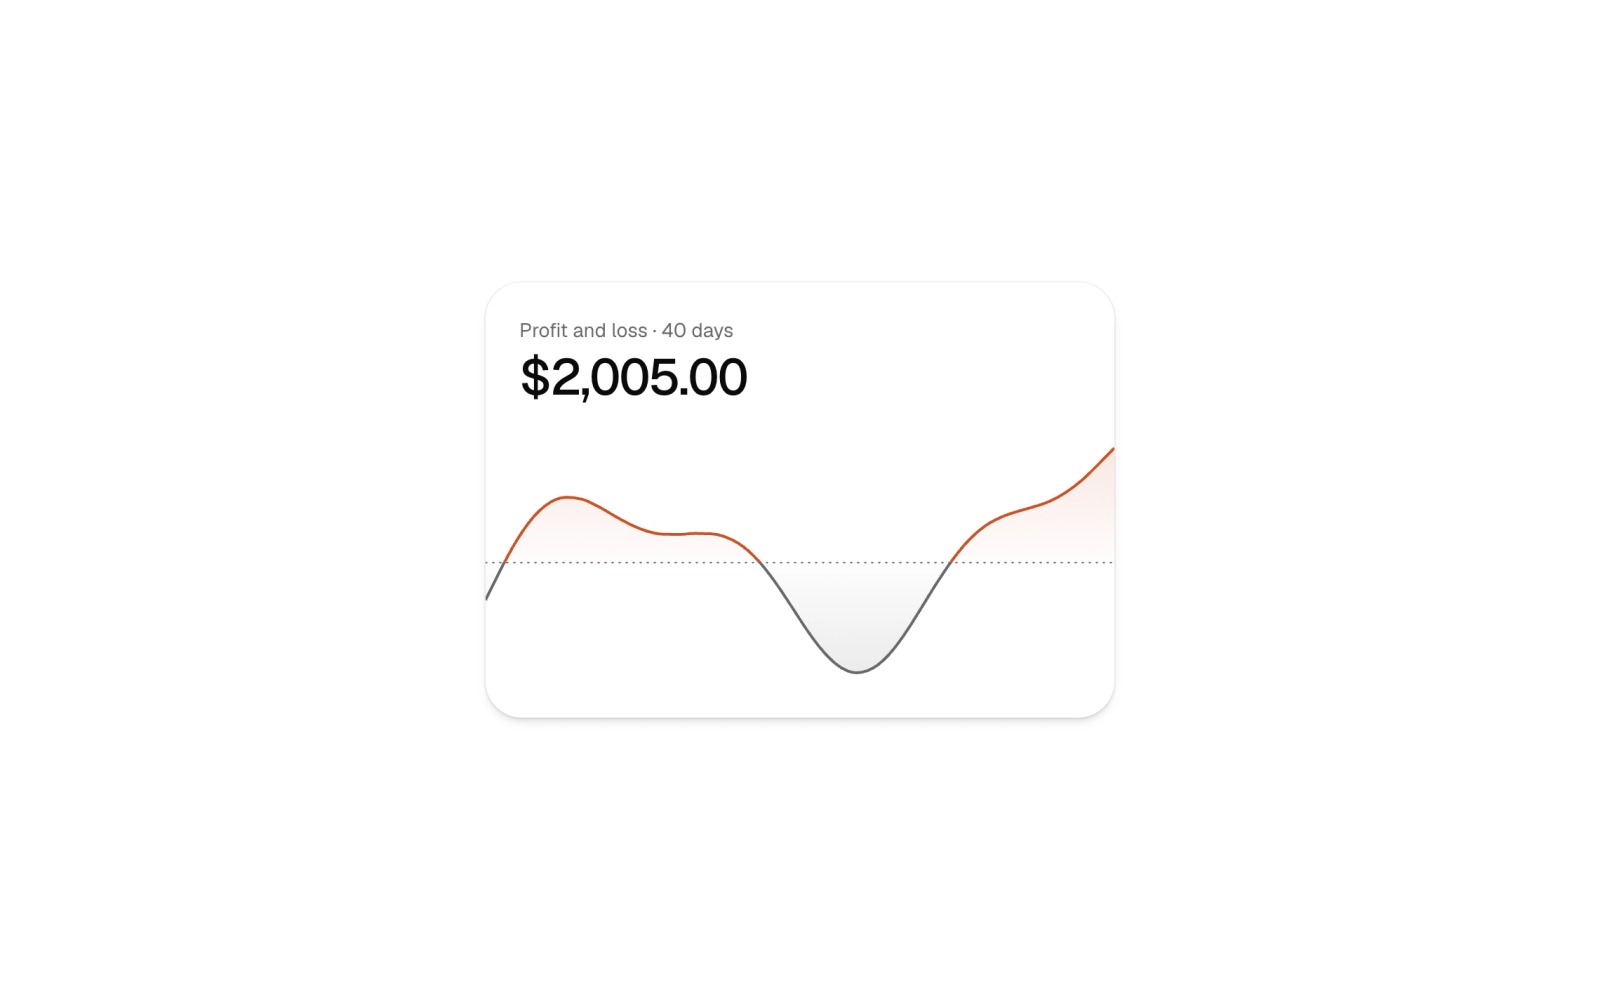
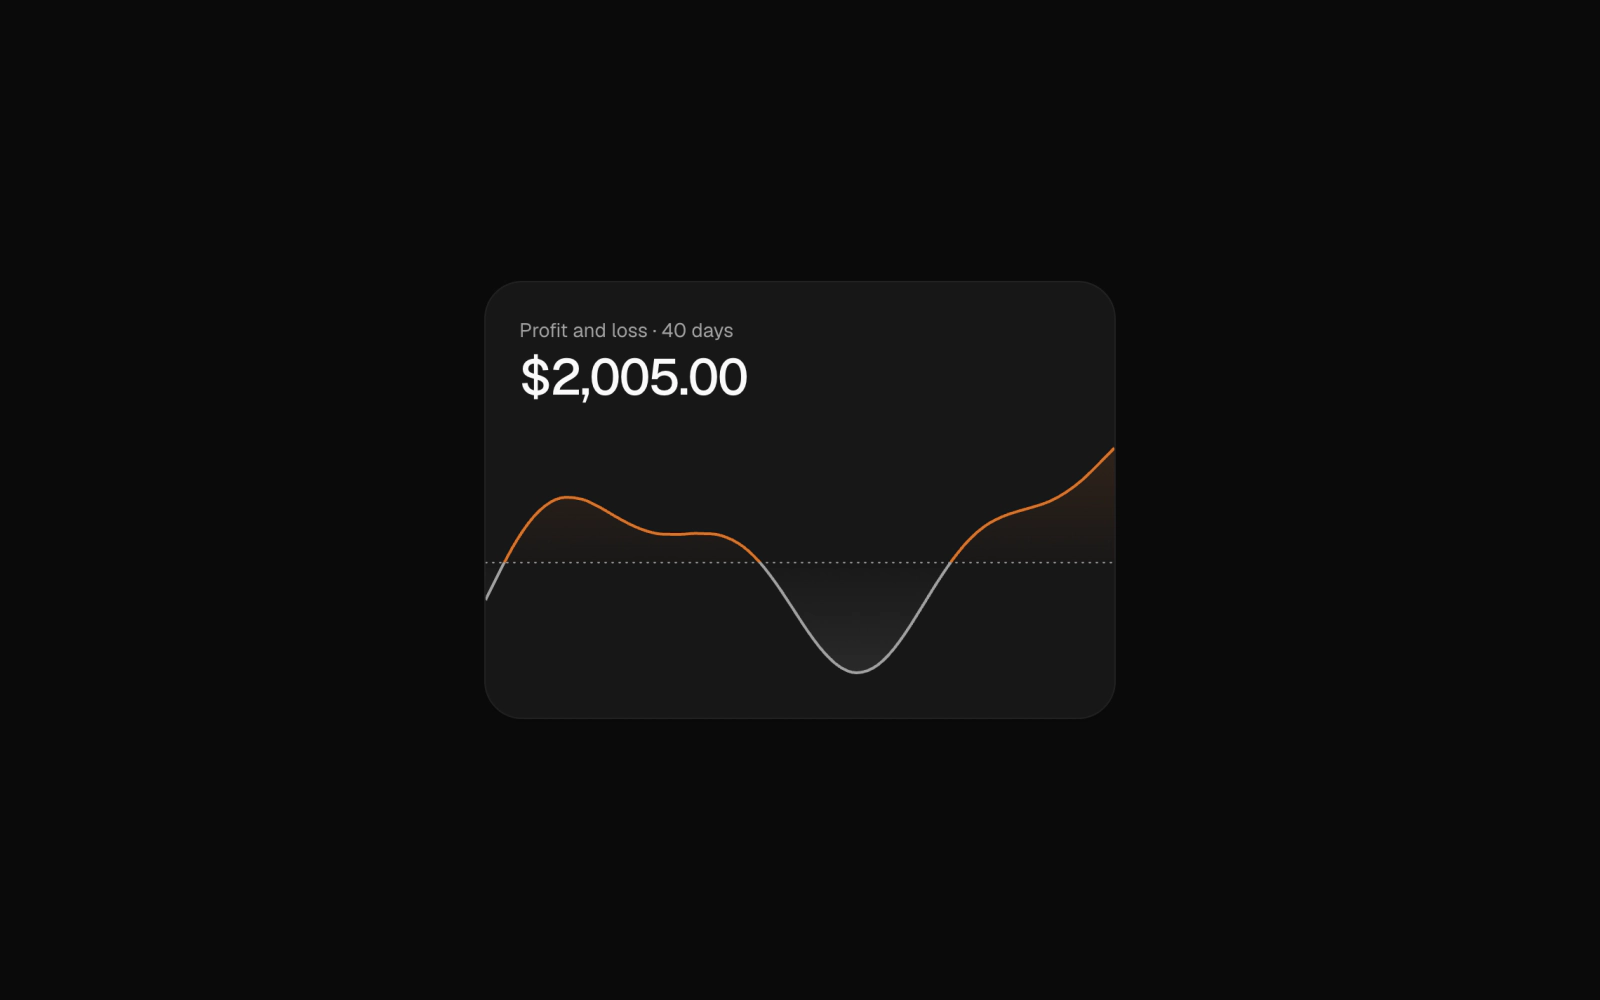
Profit and loss area chart whose line and fill change color at zero: the chart color above a dotted baseline, muted gray below, from one gradient stop.
Sprint Progress Ring
radial-chart-04
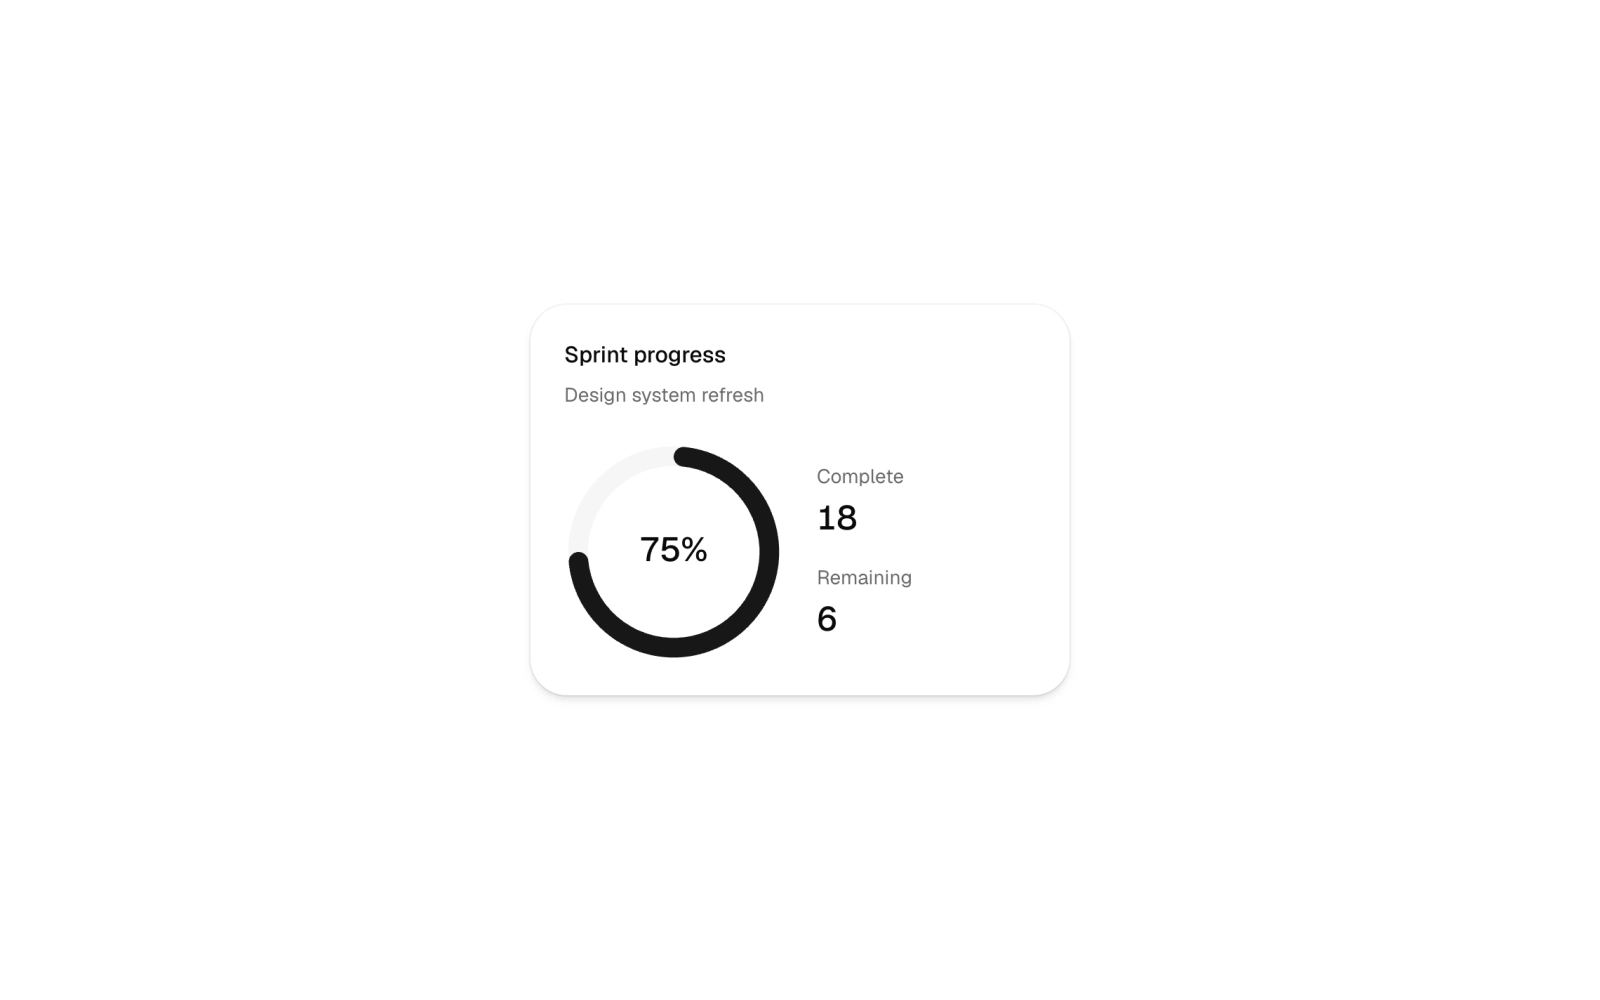
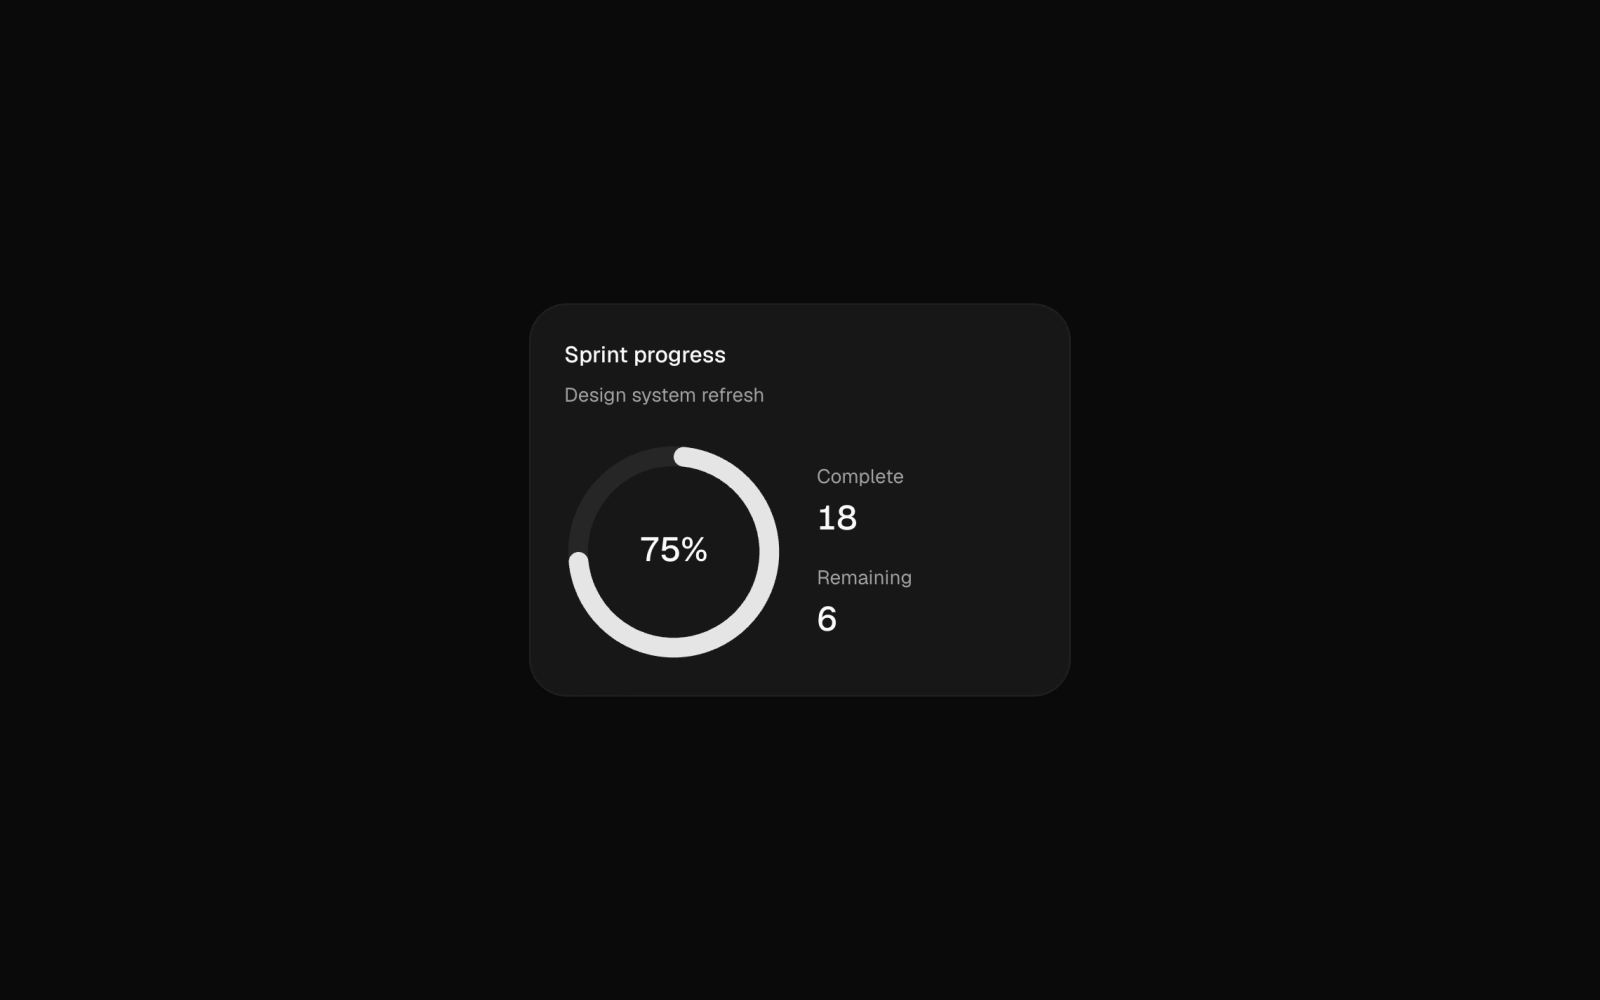
Compact radial progress ring for sprint task completion, beside completed and remaining task counts. Built on shadcn Card and Chart parts, with the task total setting the full circle on recharts 3.8.
Storage Capacity Gauge
radial-chart-02
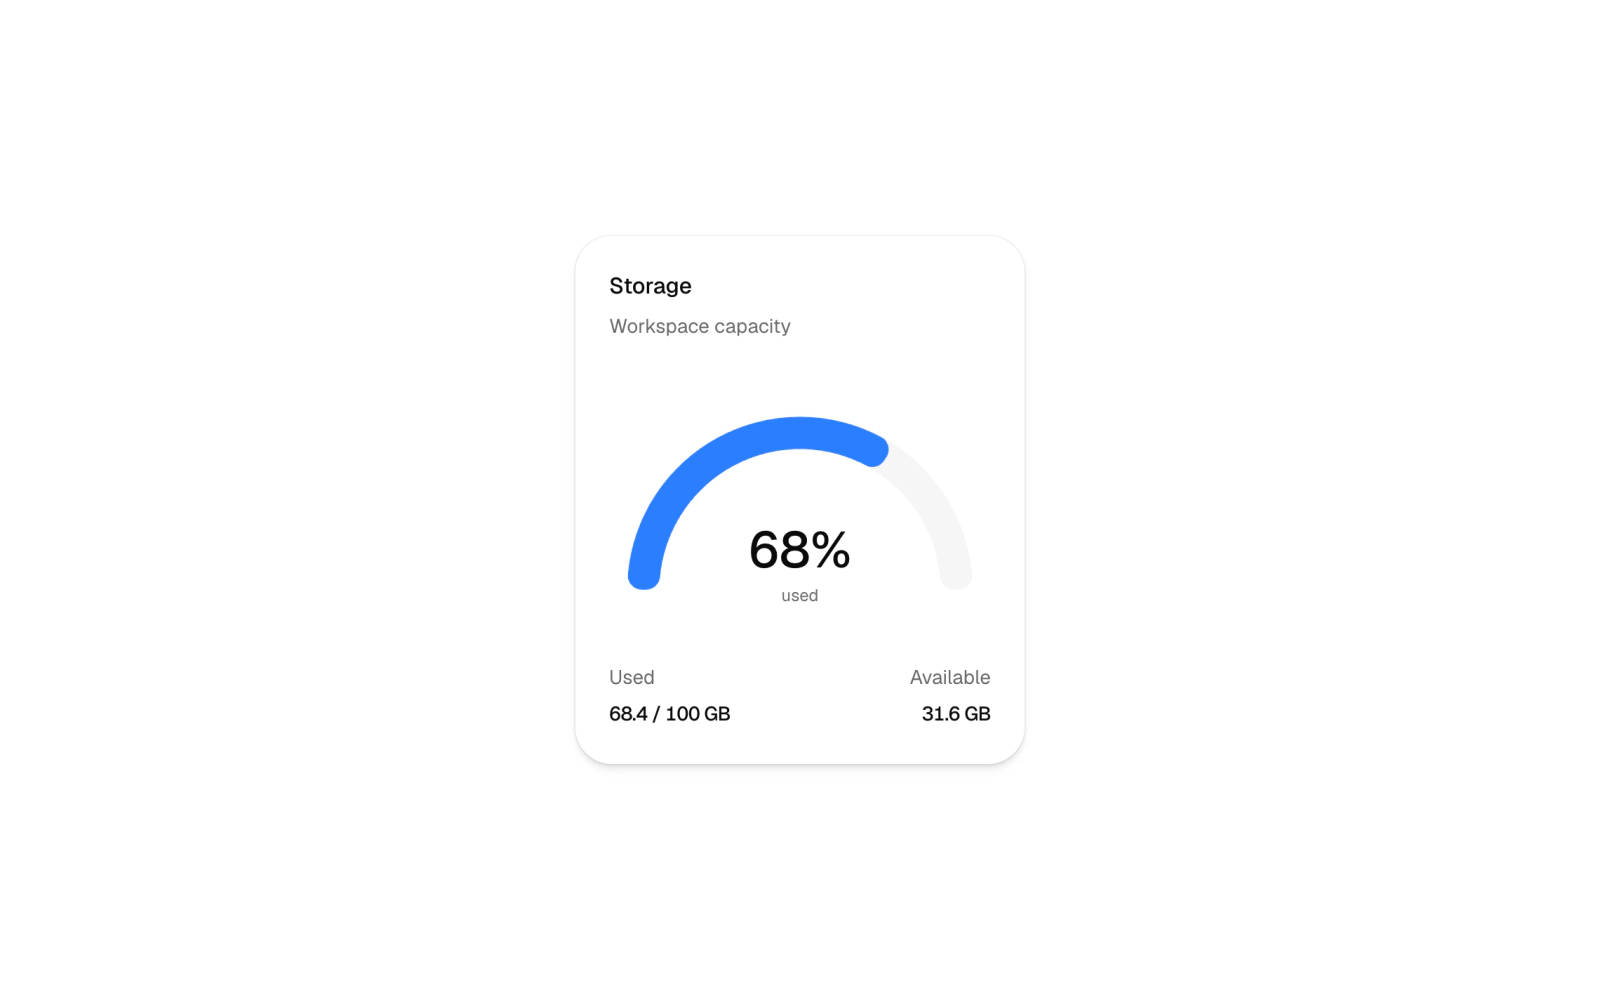
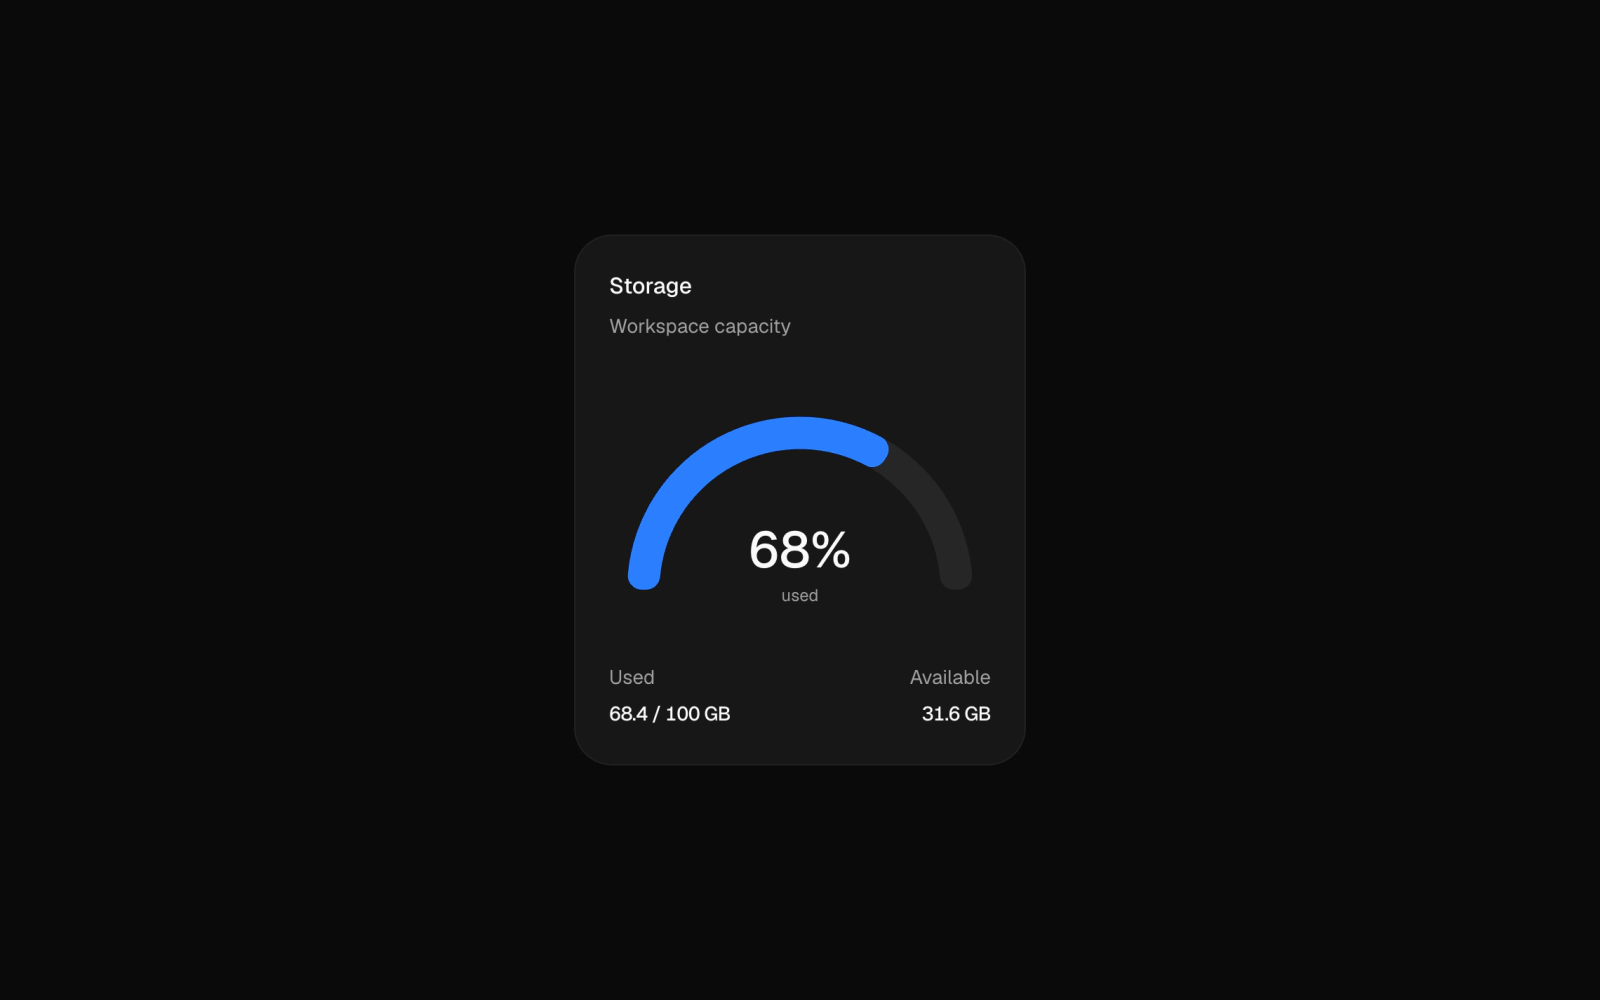
Half-circle radial gauge for storage capacity on a dashboard, with used and available GB below it. Built on shadcn Card and Chart parts with a capacity-based axis on recharts 3.8.
Time Back Bars
bar-chart-10
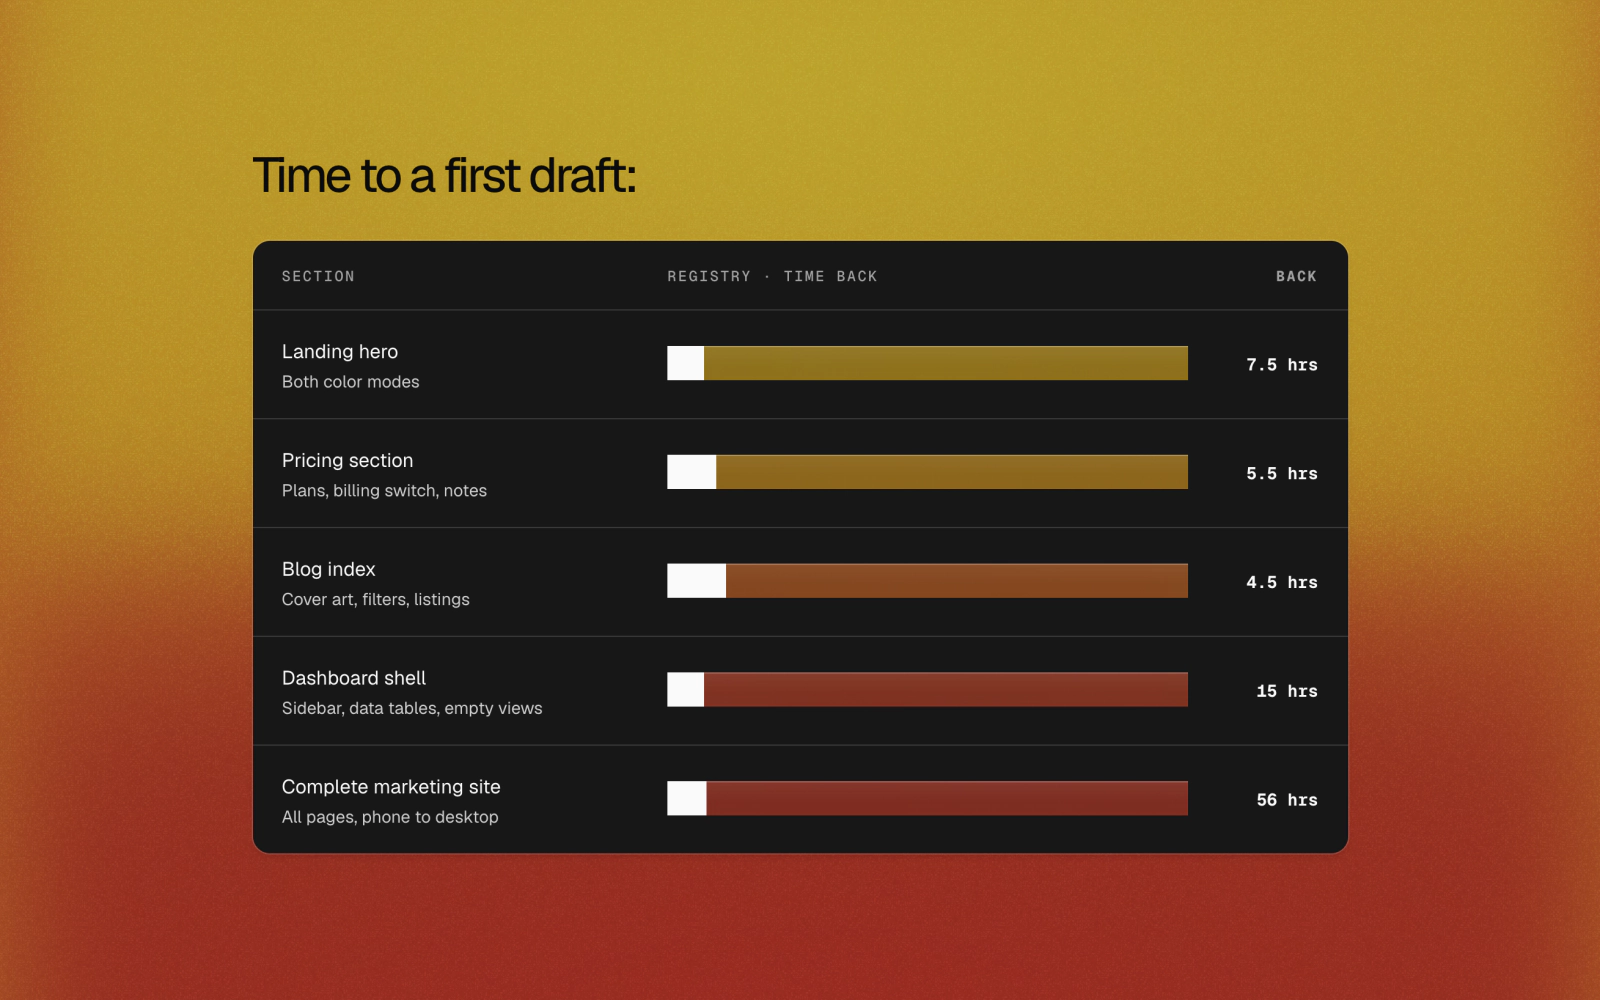
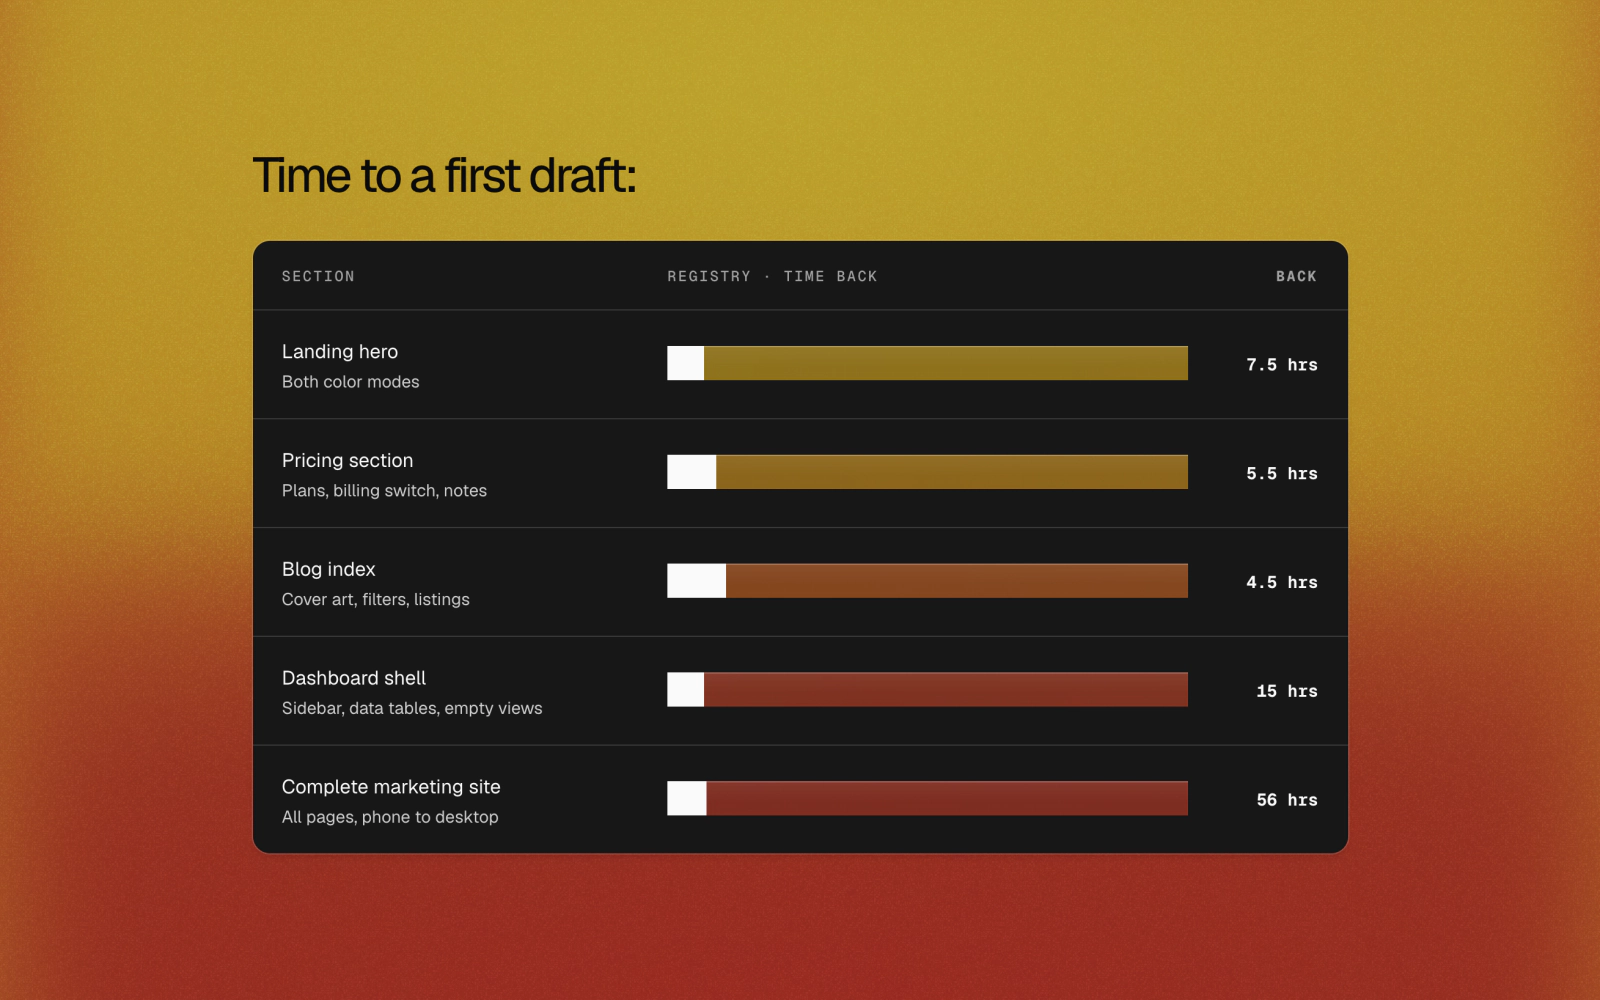
Hand-built against registry build times as bars on a warm wash: the solid sliver is the registry and the saved time is cut out of the dark card so the wash glows through. Mono figures, table semantics.
Traffic Overview
traffic-overview
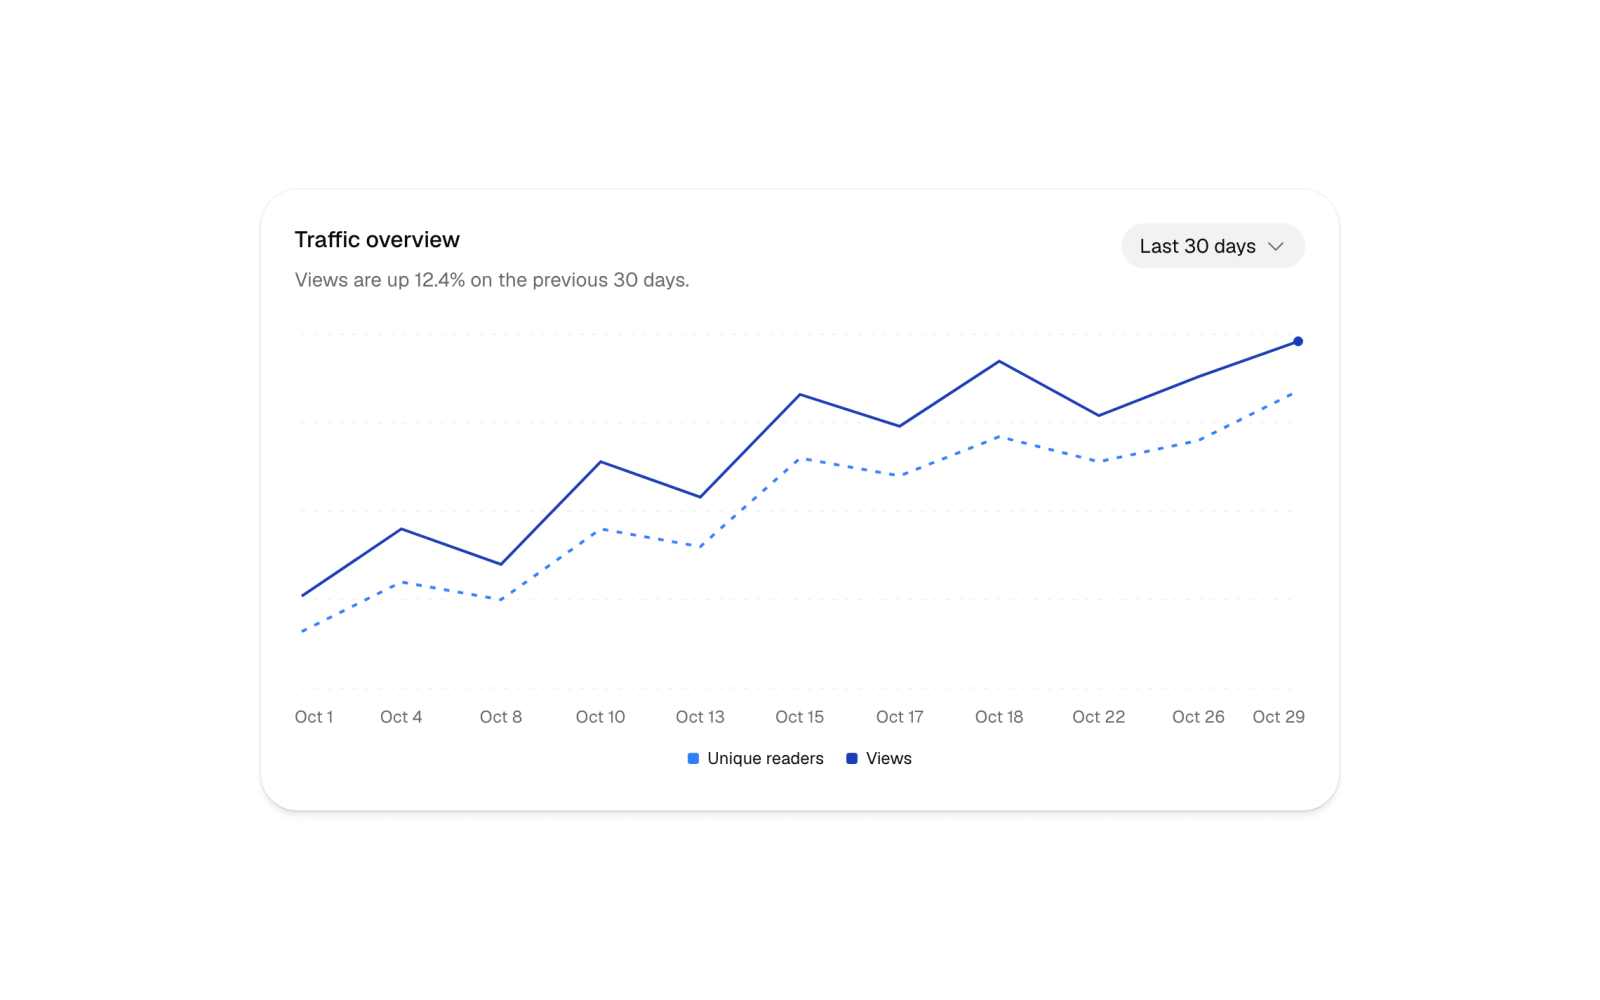
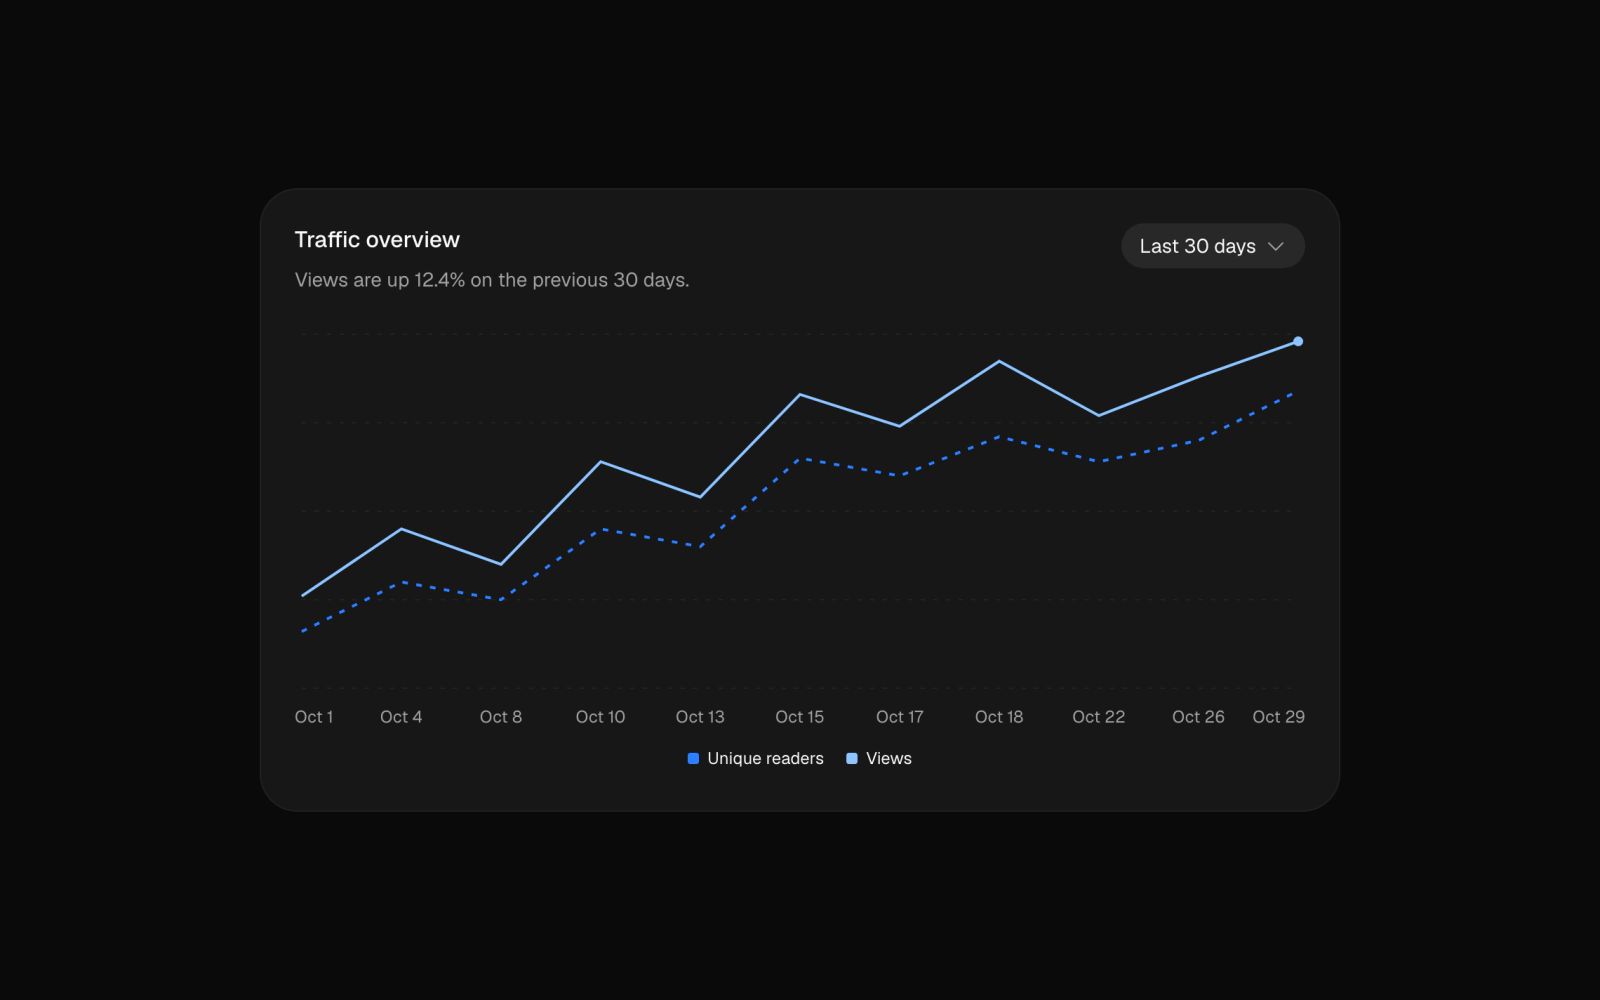
Website traffic analytics line chart card: views and unique readers over time, a date range select, a legend and a dot on the busiest day. The views color changes between light and dark. Uses recharts 3.8.
Wash Under the Line
area-chart-06
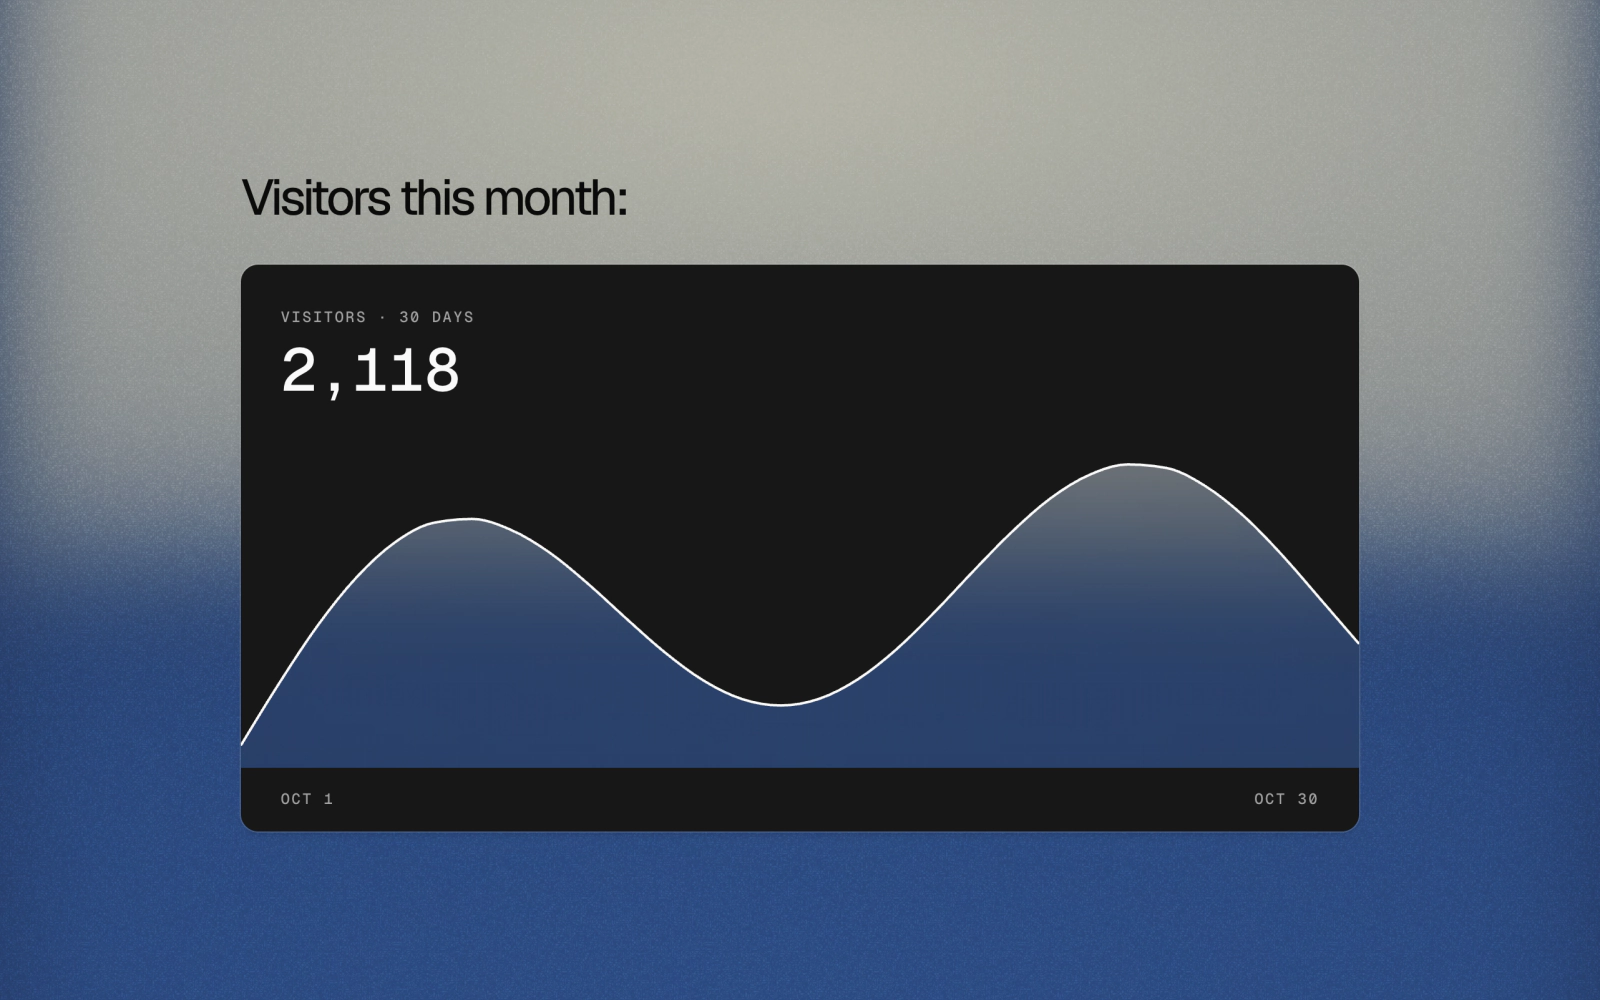
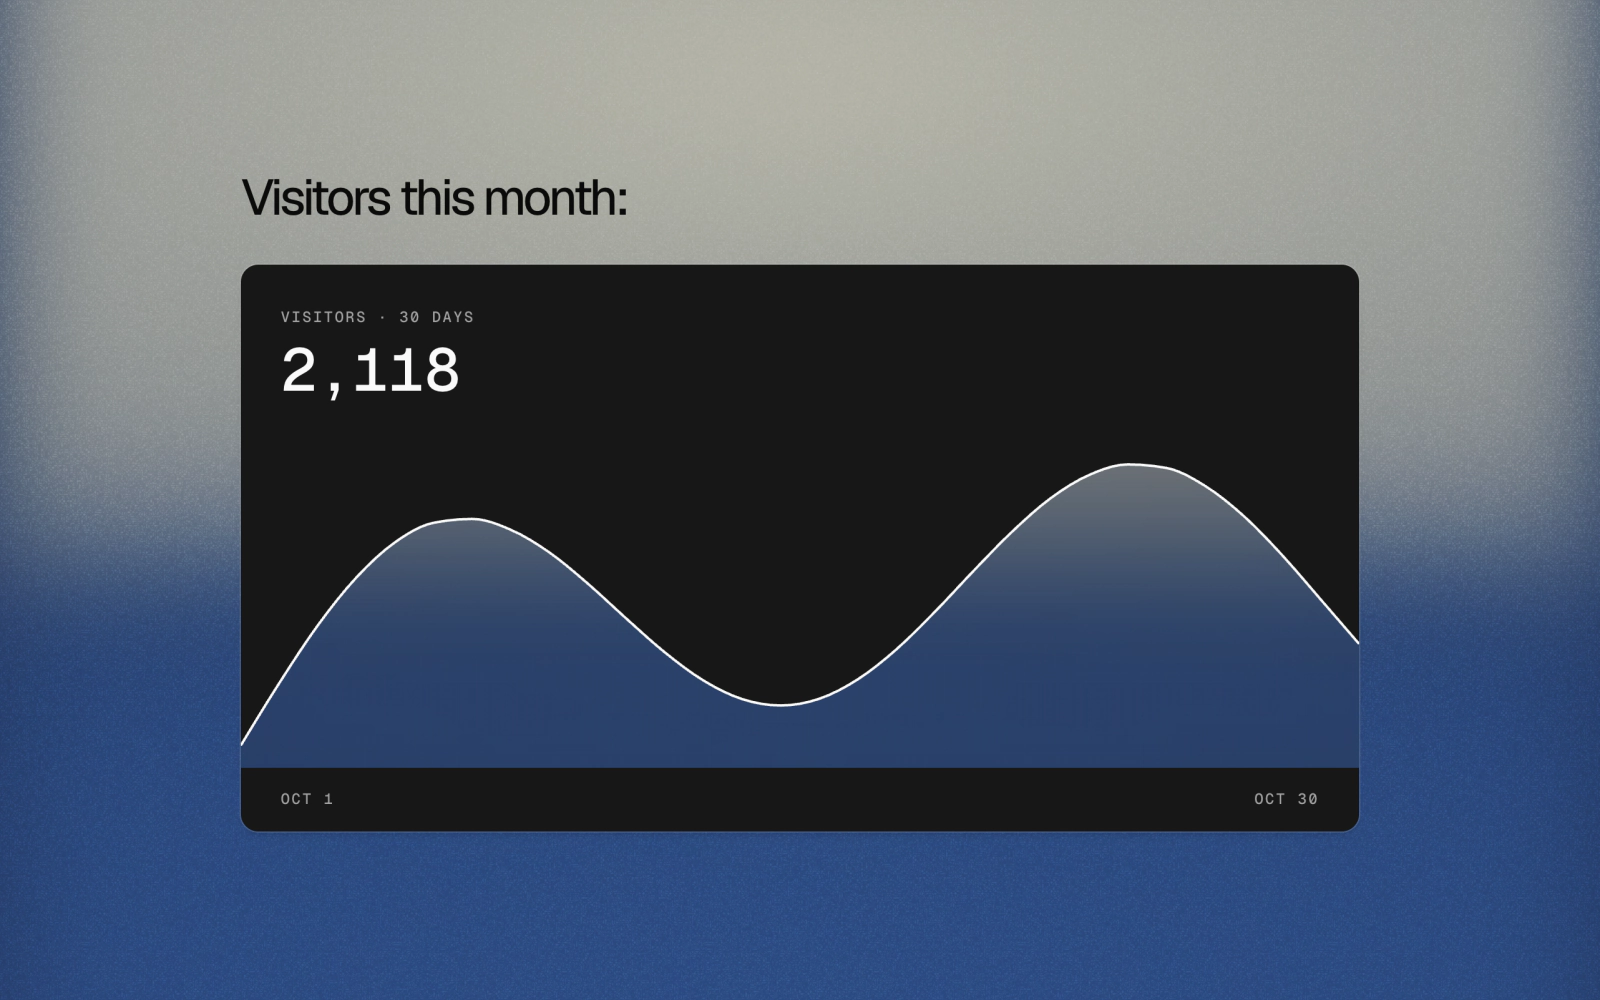
Area chart on a delft wash where the dark card stops at the line: above it is card, below it the card is cut away so the area below is frosted glass with the wash showing through. Mono figure, tooltip on hover.
Weekly Goal Radial Chart
radial-chart-01
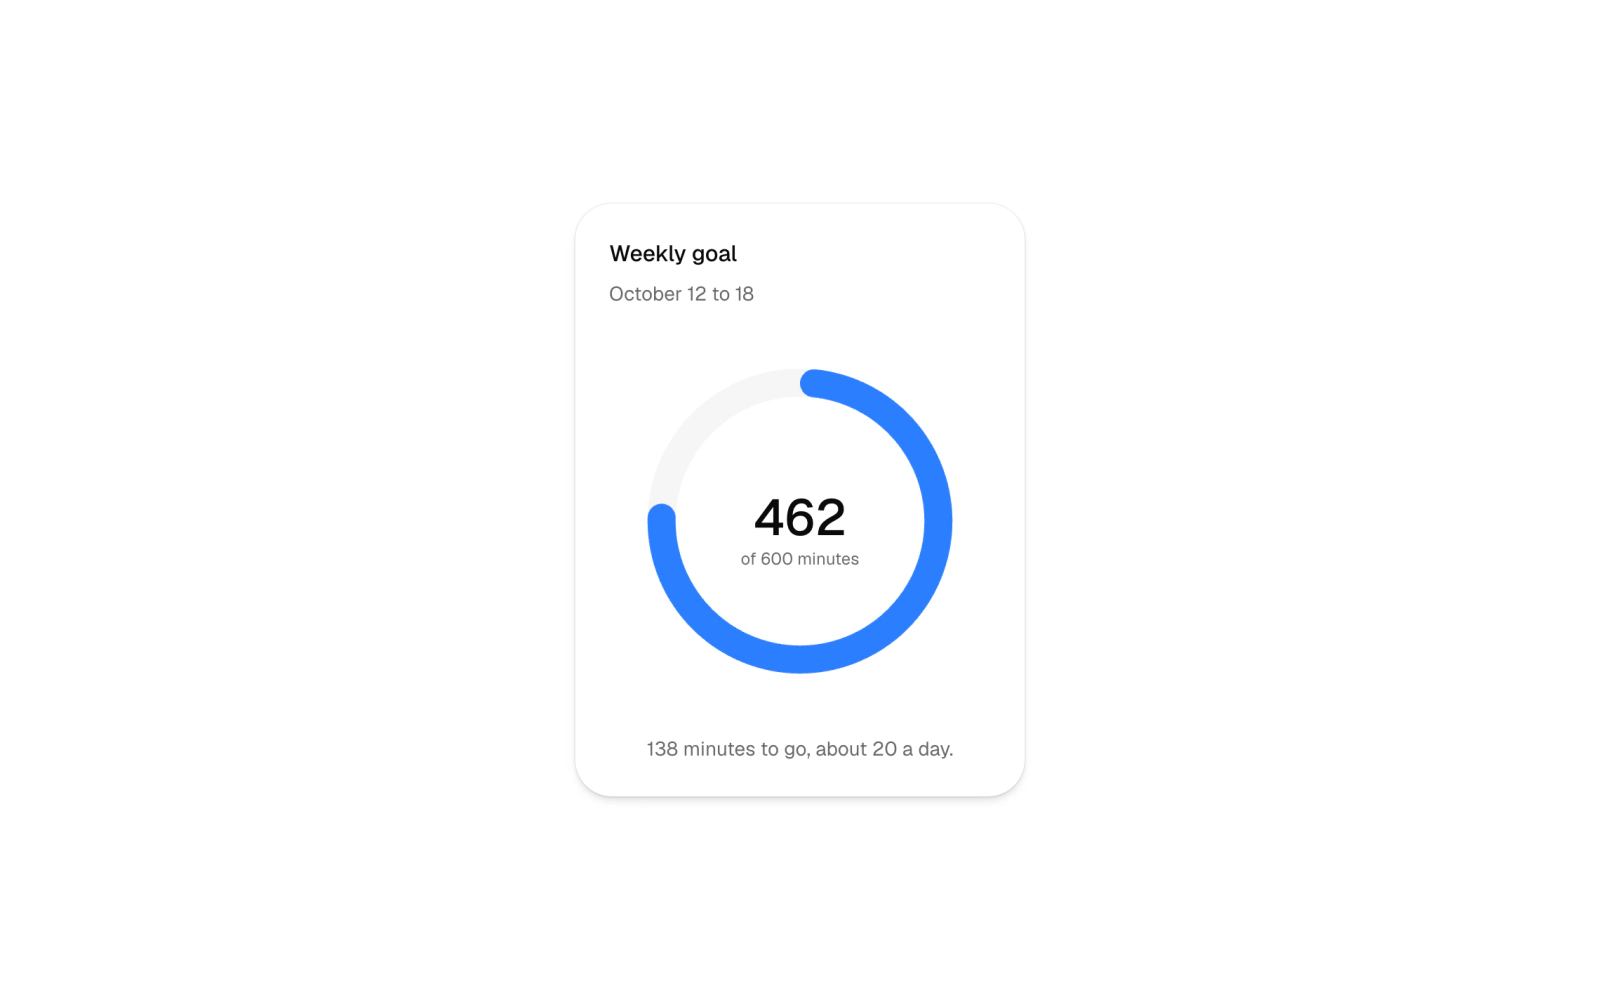
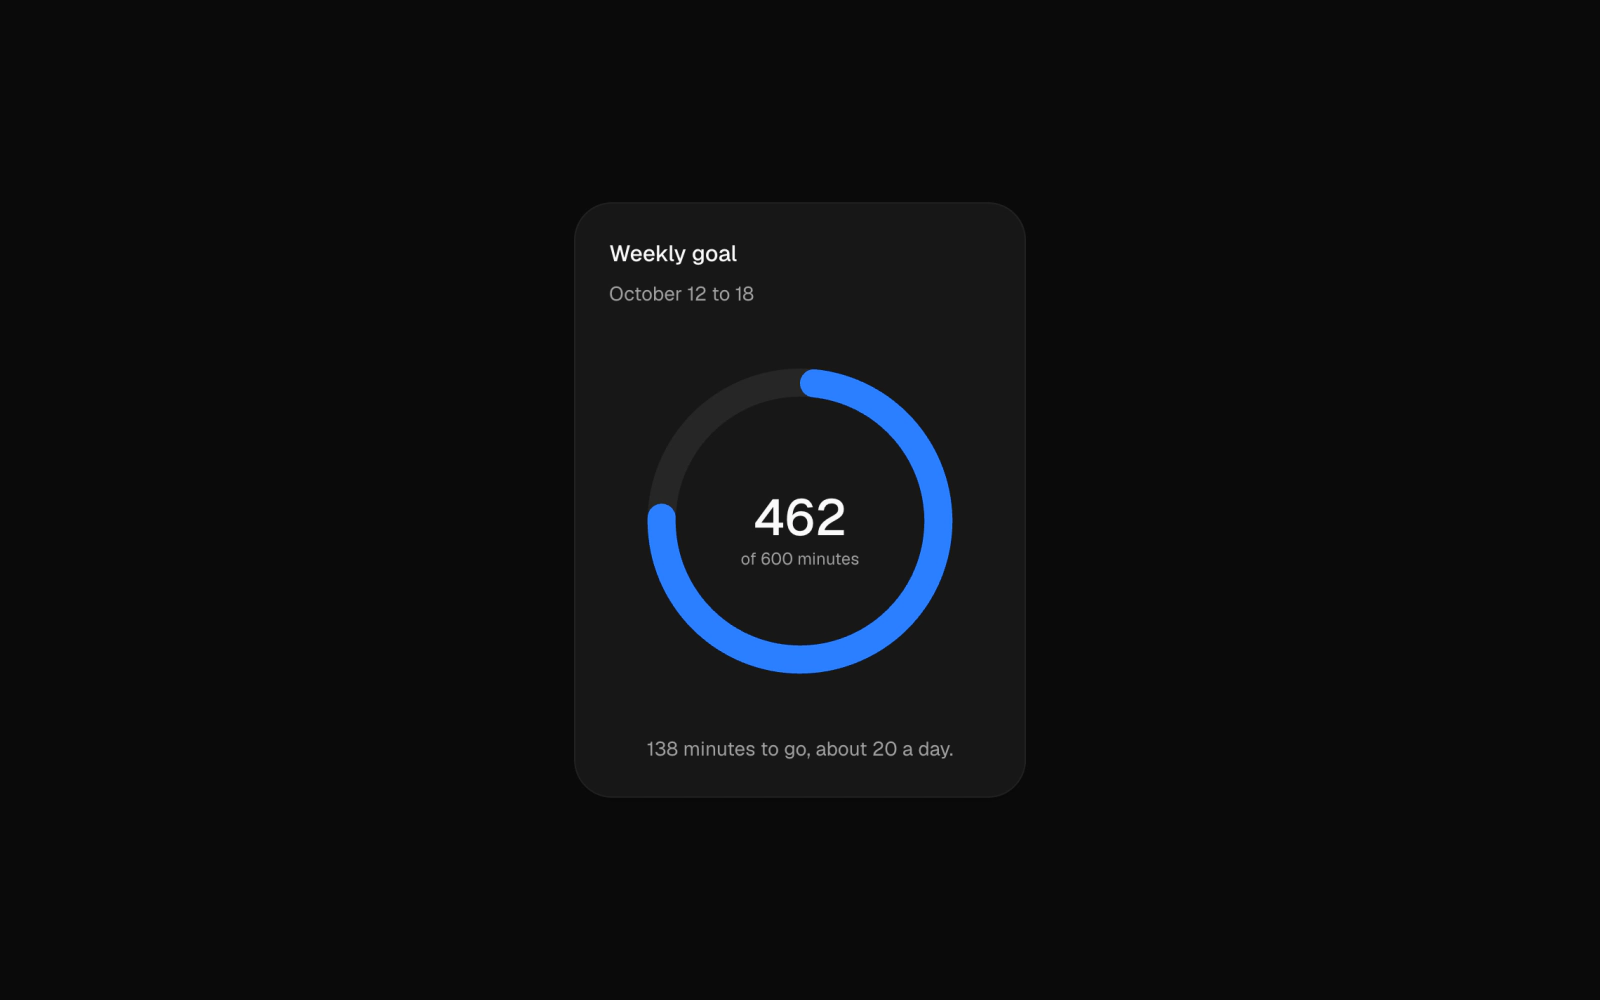
Radial progress ring card for goal tracking: a narrow card showing progress toward a weekly listening goal, minutes in the center, the remaining track visible and a footer note.
Window Grid
waffle-chart-01
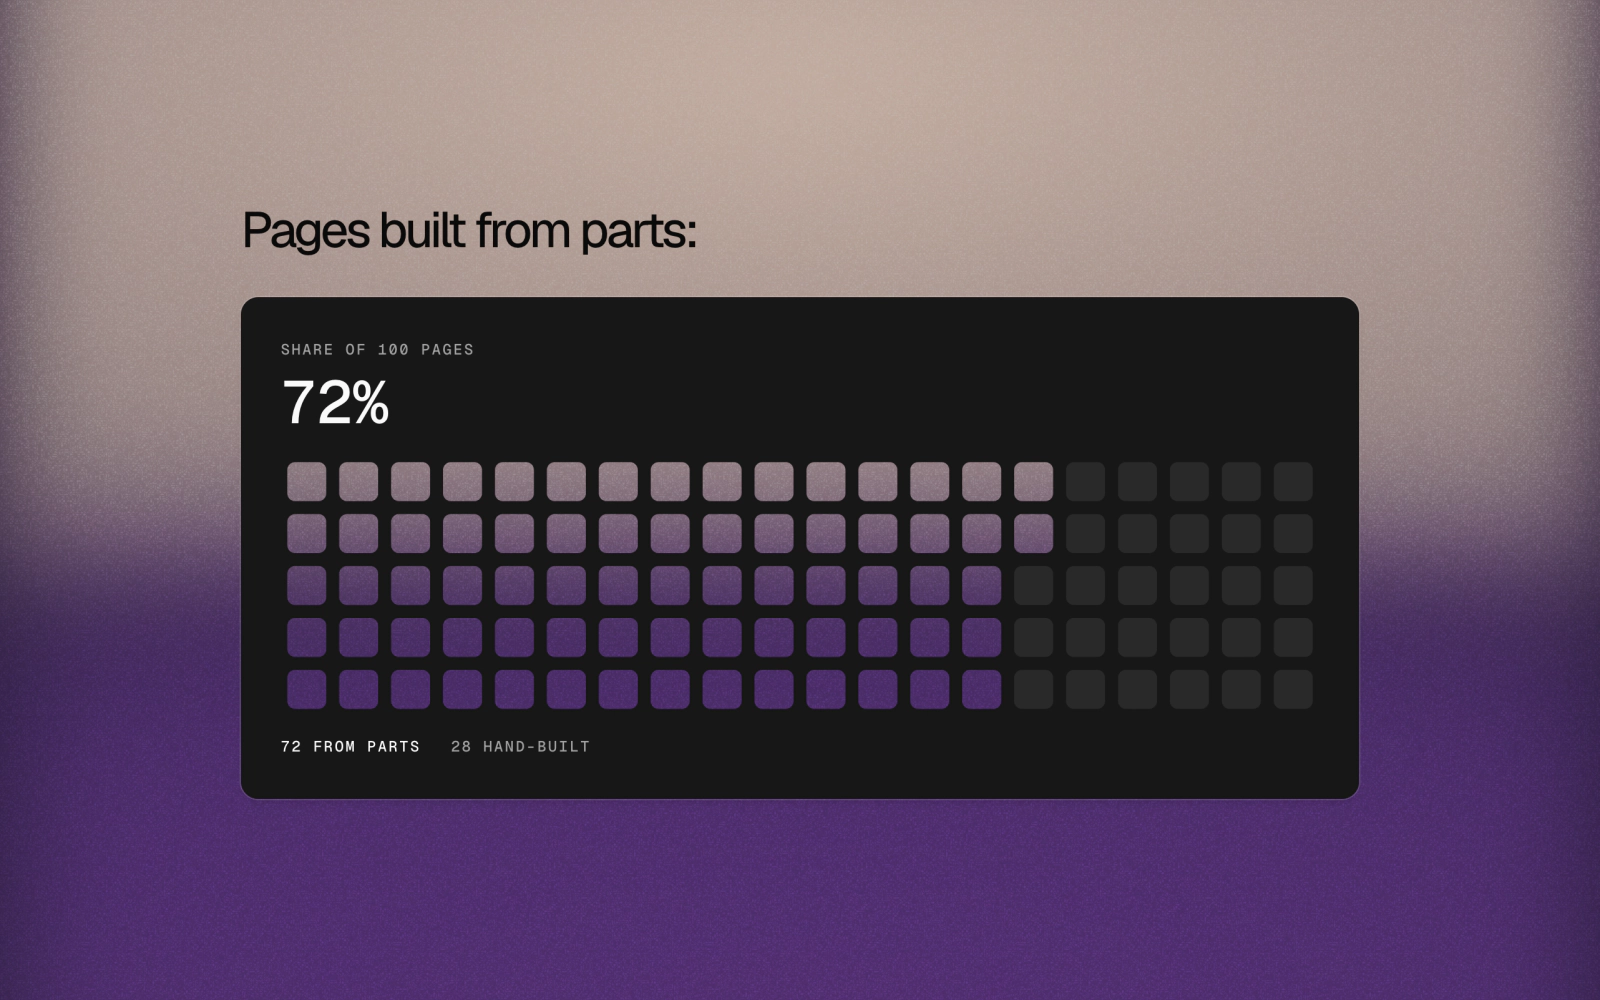
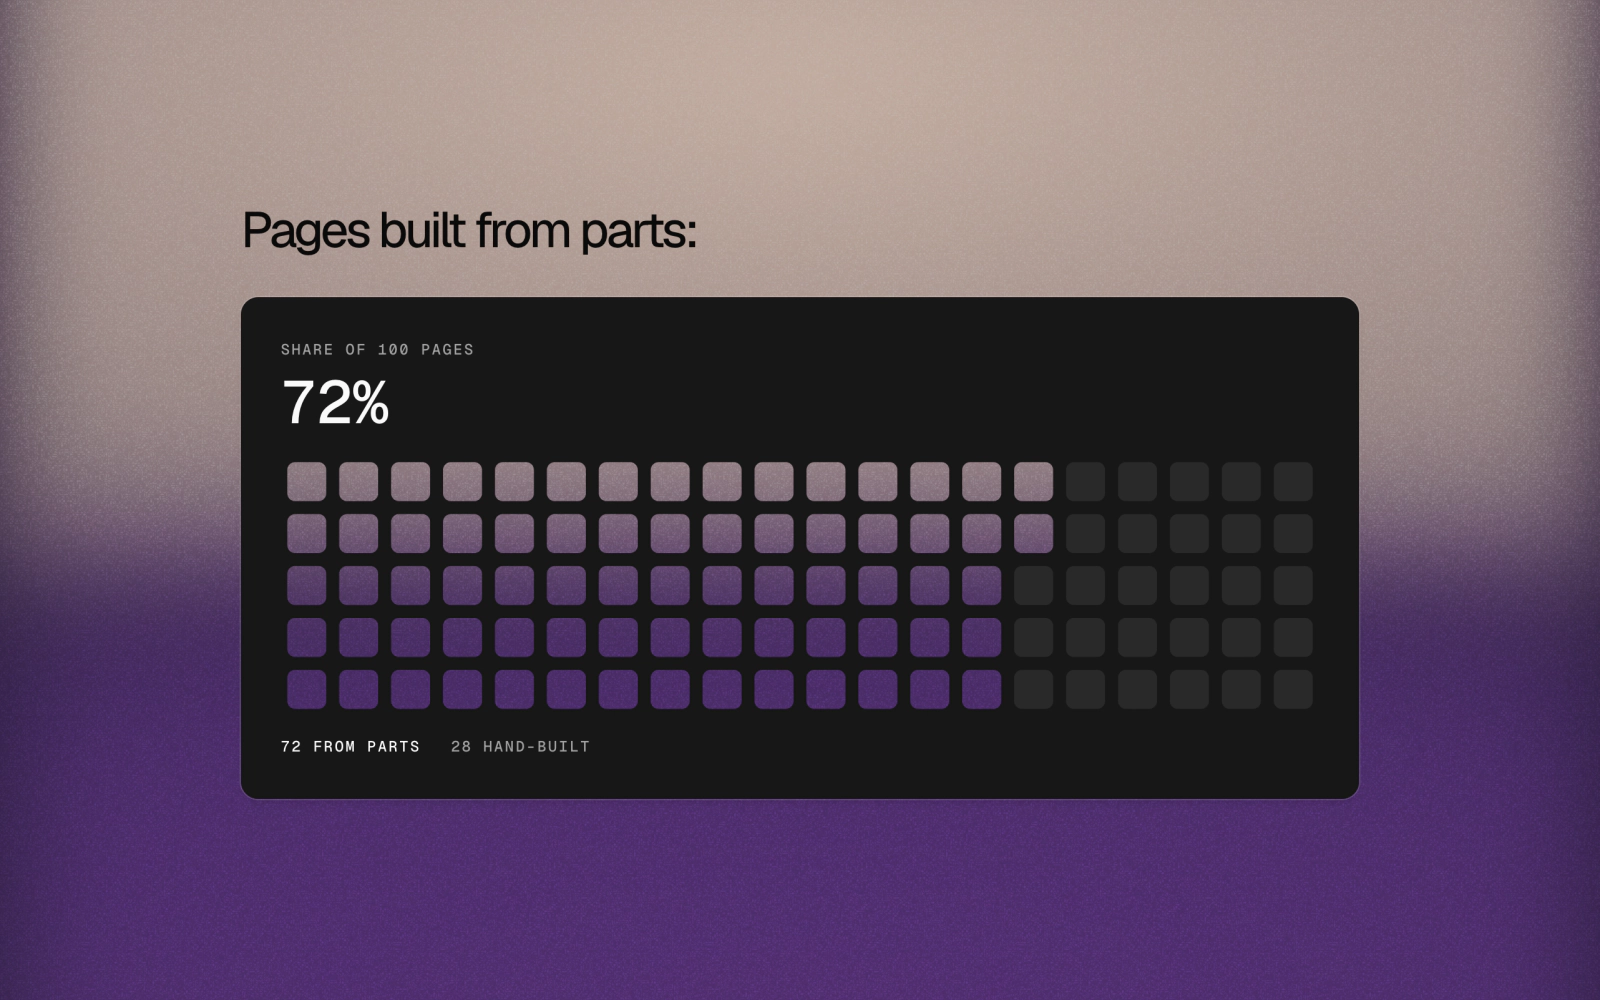
Waffle chart on a vesper wash: one cell per item, the filled share cut out of the dark card so it reads as the wash, with a mono percentage and counts.
Zone Axis Line
line-chart-03
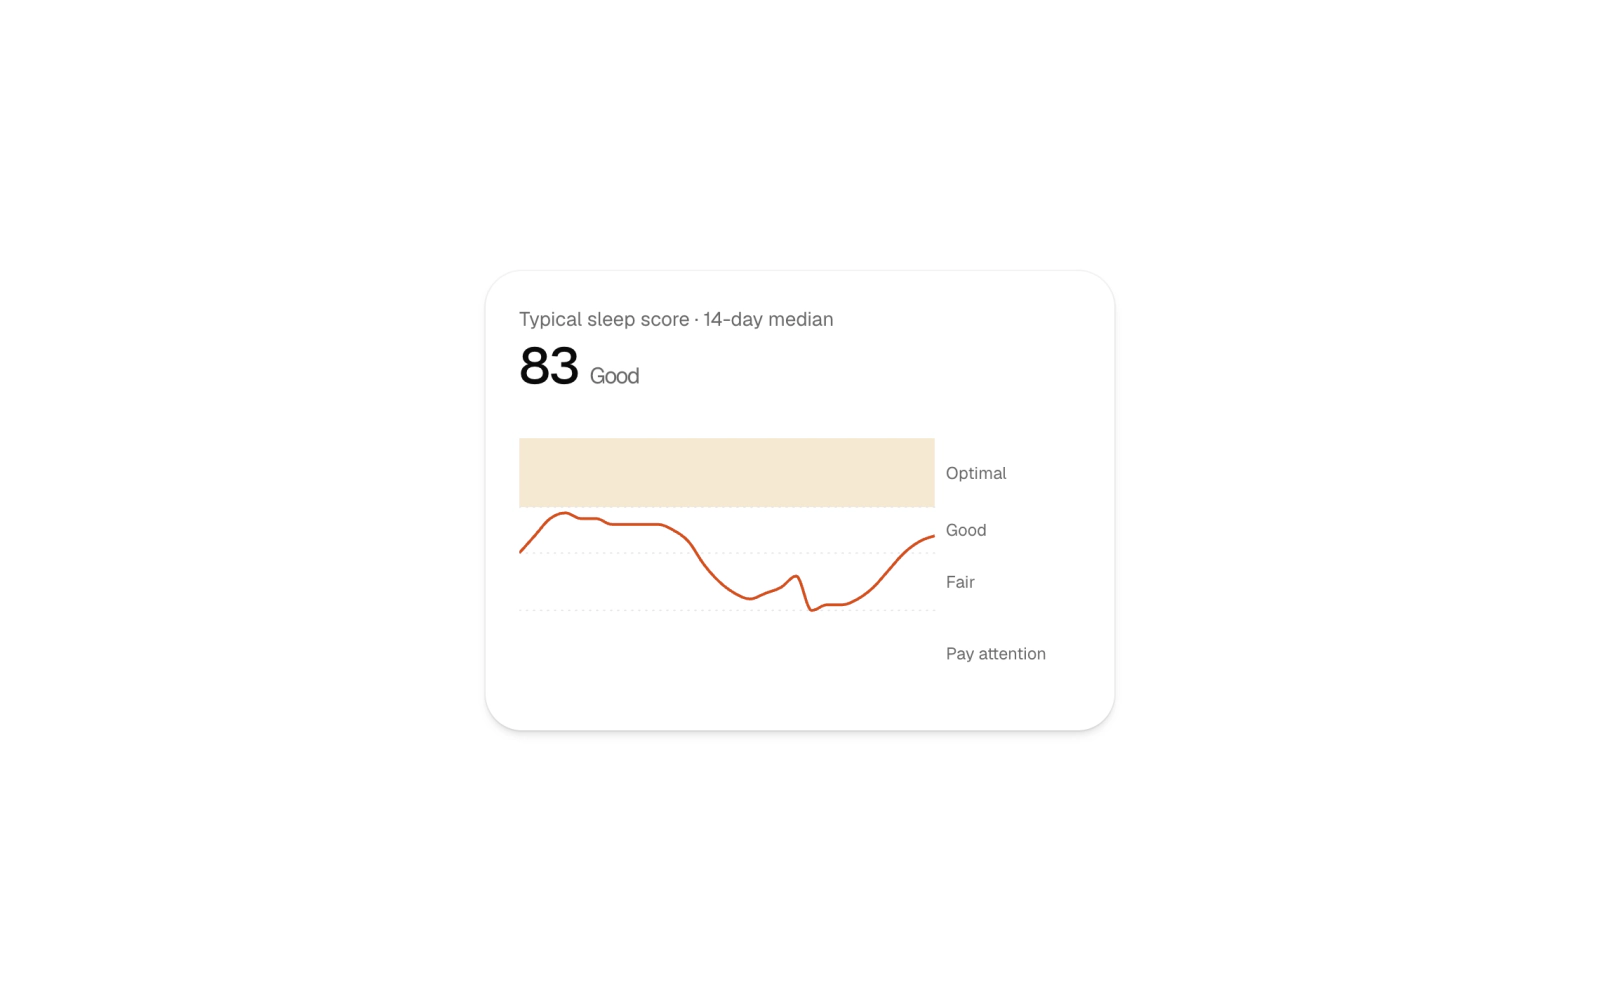
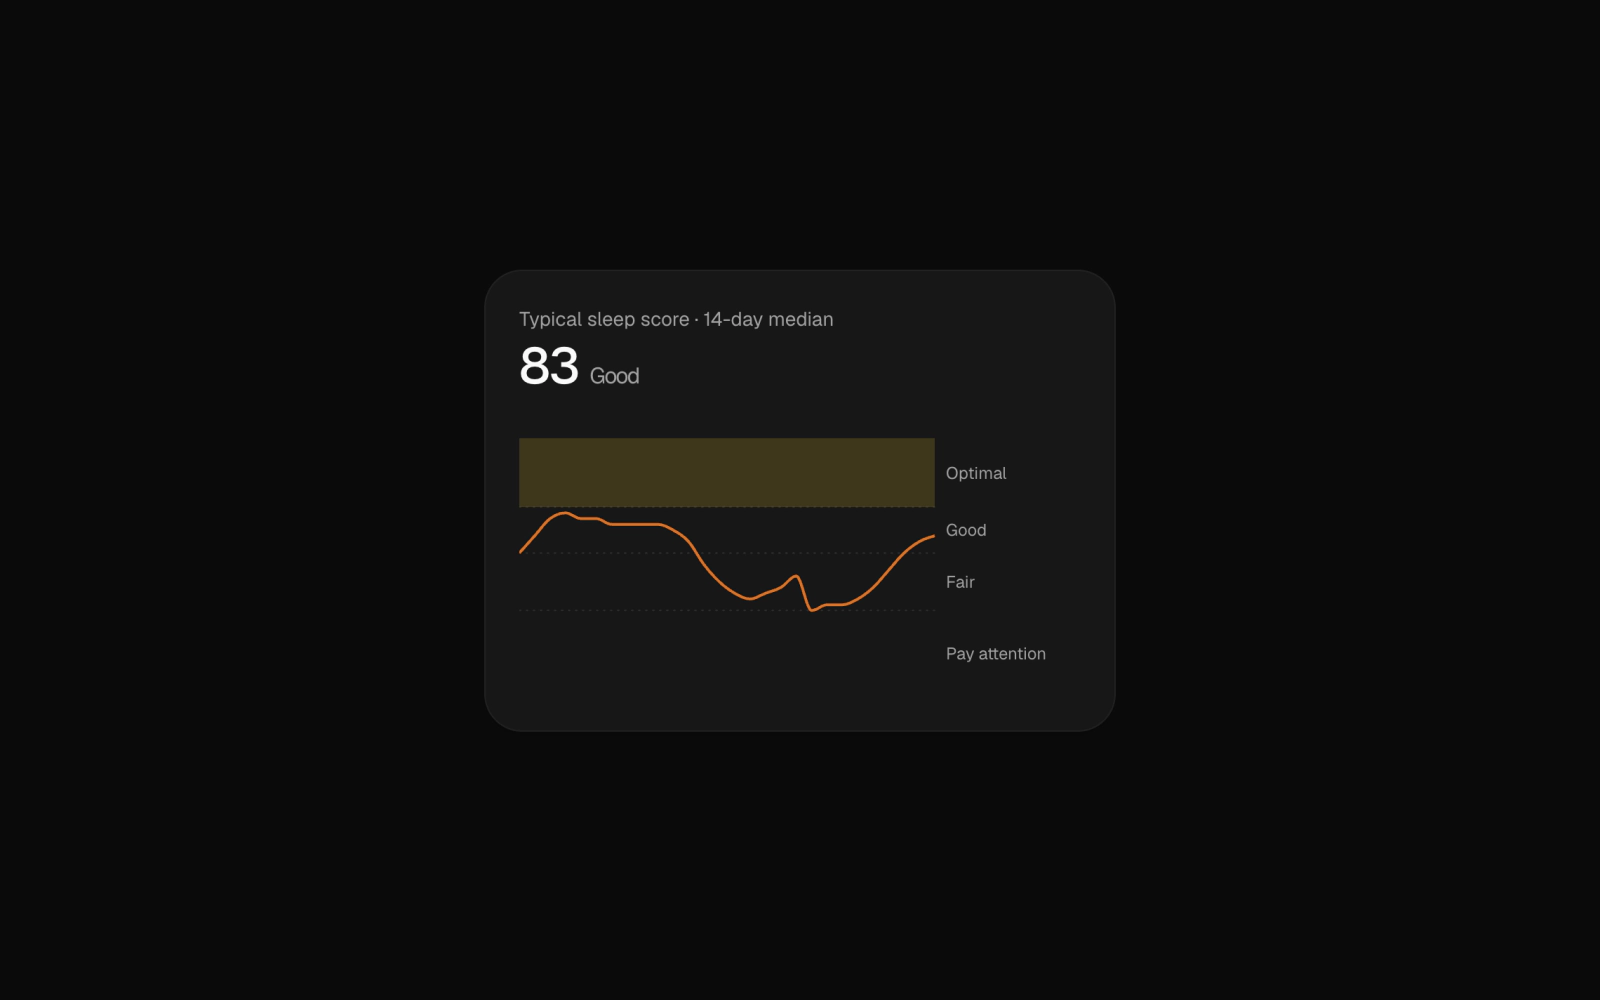
Score line chart whose axis names zones instead of counting: tick labels at each zone middle, dotted zone boundaries and a shaded target band, with the current zone beside the value.